A weaker dollar leads to stronger commodities: This time, it's not geopolitics that's holding up the pressure, but exchange rates.
2026-01-20 21:38:41
On Tuesday (January 20), despite renewed tensions between the US and Europe that triggered increased risk aversion in the market, commodities generally performed unusually strongly. On the surface, geopolitical conflicts often suppress risk appetite and lead to widespread asset declines, but this time was different: the dollar quietly weakened, becoming a key force supporting commodity prices.
The US dollar is the global pricing currency, and when it depreciates, dollar-denominated commodities become "cheaper" for non-US dollar funds. This exchange rate advantage often attracts overseas buyers, creating marginal buying pressure. Especially during periods of increased volatility, such capital flows quickly translate into price support. Therefore, even in a bearish macroeconomic environment, most commodities can withstand pressure, experiencing limited declines or even rising against the trend.
Analysts noted that this support is more like a "safety cushion" than an engine driving sustained price increases. What truly determines whether prices can break through is the tightness of spot supply and demand and the persistence of policy disturbances. In other words, a weaker dollar has helped hold the line for commodities, but whether they can rise depends on whether there is "something to speculate on."
Brent crude futures rose slightly, a strong performance given the overall pullback in risk assets. This reflects a tug-of-war between bulls and bears: on the one hand, geopolitical concerns are suppressing risk premiums; on the other hand, a structurally tight spot market and a weak dollar are providing support for the bulls.
The most noteworthy signal comes from the inter-month spread—the price difference between near-term and far-term contracts. This indicator remains strong, suggesting the market is willing to pay higher prices for immediate delivery of oil. This near-term premium structure (also known as a "spot premium") is a classic sign of tight supply. It not only increases the cost of short positions but also makes oil prices more resilient during price adjustments.
The latest supply shock comes from Kazakhstan. A major local producer suspended production at the Tengiz and Korolev oil fields due to a fire in its power facilities, affecting daily output by approximately 890,000 barrels. While the duration of the shutdown is uncertain and may not alter the overall supply and demand landscape for the year, it amplifies short-term uncertainty. More importantly, this is not an isolated incident—the country's exports via the Caspian pipeline have been repeatedly disrupted by drone attacks in recent months. These ongoing geopolitical disturbances are causing the market to gradually factor them into long-term risk premiums. This means that even without new unforeseen events, oil prices may be less likely to fall sharply due to "fixed expectations."
If the support for crude oil comes from physical constraints, then the rise in refined oil prices is more driven by policy. Recently, the ICE diesel crack spread has strengthened again, rising to nearly $25 per barrel. This figure represents the profit a refinery can earn from processing one barrel of crude oil; its strengthening suggests that refined oil supply is tighter than crude oil supply, or that refinery supply is not flexible enough.
The core catalyst for this round of price increases is the new EU ban scheduled to take effect on January 21: prohibiting the import of refined petroleum products processed from Russian crude oil. Although the market had anticipated this and traders had adjusted their shipments in advance, the "timing effect" should not be underestimated. In the initial stages of the policy's implementation, increased friction costs due to logistics certification, compliance reviews, and changes in transportation routes may further drive up price volatility.
The most affected are the export chains of Indian refineries to Europe. It is understood that some Indian refineries are adjusting their crude oil procurement structures, attempting to maintain sales to Europe by blending non-Russian crude. While this move appears flexible, it actually raises compliance thresholds and marginal supply costs. More importantly, this "policy transmission" not only affects refined oil prices but also has a reverse effect on the crude oil market—the price differences between different grades and sources of crude oil may be restructured as a result.
Meanwhile, precious metals are also putting on a remarkable show. Gold has risen about 8% year-to-date, while silver has surged by 30%. Both are safe-haven assets, but the significant difference in their gains reflects their different attributes: gold is seen as a "steady-state hedging tool," while silver, due to its industrial applications, exhibits greater resilience during periods of loose liquidity and high sentiment.
Behind this surge, besides geopolitical factors such as escalating tensions between Europe and the US and the Greenland dispute, another underlying factor is emerging: frequent pressure from the US government on the Federal Reserve has raised concerns among investors about the central bank's independence. Once monetary policy is perceived as being subject to political interference, inflation expectations will derail, and the creditworthiness of government bonds will be questioned. In this environment, gold and silver become the preferred assets for hedging against "currency devaluation" and "systemic risks," thus reigniting the so-called "devaluation trading."
Among industrial metals, copper's performance has been particularly noteworthy. The price rebound to nearly $13,000 per ton, seemingly driven by a recovery in demand, is actually more likely a result of market structural "self-correction." Previously, due to tariff expectations and inverted regional price differentials, a large influx of copper into the United States caused US warehouse inventories within the LME system to briefly reach zero, resulting in extreme regional tightness.
The situation has now reversed: the latest data shows that the warehouse's inventory has rebounded by 950 tons. Although the base was extremely low, the fact that it went from "zero" to "something" is a strong signal. This means that the previously distorted spot market structure is loosening. Why has this changed? The core reason is that the London Metal Exchange (LME) spot price is now higher than the near-month futures price on the New York Mercantile Exchange (COMEX), reversing last year's arbitrage logic.
In the past, higher COMEX prices attracted global copper flows to the United States; now, however, cross-market movement is no longer profitable, funds are flowing back to other regions, and inventories are recovering. This change indicates that the extreme imbalance in the copper market is gradually normalizing.
In summary, the current main theme in the commodity market is not a simple shift between a bull and bear market, but rather a structural rebalancing driven by a confluence of multiple forces. A weaker dollar provides bottom support, but the real driving forces come from tight spot markets, policy costs, and changes in cross-market price spreads. The key questions going forward are no longer "will commodities rise," but rather "which segment of the curve will break or recover first" and "which trade flows are quietly changing course."
The US dollar is the global pricing currency, and when it depreciates, dollar-denominated commodities become "cheaper" for non-US dollar funds. This exchange rate advantage often attracts overseas buyers, creating marginal buying pressure. Especially during periods of increased volatility, such capital flows quickly translate into price support. Therefore, even in a bearish macroeconomic environment, most commodities can withstand pressure, experiencing limited declines or even rising against the trend.
Analysts noted that this support is more like a "safety cushion" than an engine driving sustained price increases. What truly determines whether prices can break through is the tightness of spot supply and demand and the persistence of policy disturbances. In other words, a weaker dollar has helped hold the line for commodities, but whether they can rise depends on whether there is "something to speculate on."
The reason why crude oil prices haven't fallen is because "the near term is too tight" and "the long term is too loose."
Brent crude futures rose slightly, a strong performance given the overall pullback in risk assets. This reflects a tug-of-war between bulls and bears: on the one hand, geopolitical concerns are suppressing risk premiums; on the other hand, a structurally tight spot market and a weak dollar are providing support for the bulls.
The most noteworthy signal comes from the inter-month spread—the price difference between near-term and far-term contracts. This indicator remains strong, suggesting the market is willing to pay higher prices for immediate delivery of oil. This near-term premium structure (also known as a "spot premium") is a classic sign of tight supply. It not only increases the cost of short positions but also makes oil prices more resilient during price adjustments.
The latest supply shock comes from Kazakhstan. A major local producer suspended production at the Tengiz and Korolev oil fields due to a fire in its power facilities, affecting daily output by approximately 890,000 barrels. While the duration of the shutdown is uncertain and may not alter the overall supply and demand landscape for the year, it amplifies short-term uncertainty. More importantly, this is not an isolated incident—the country's exports via the Caspian pipeline have been repeatedly disrupted by drone attacks in recent months. These ongoing geopolitical disturbances are causing the market to gradually factor them into long-term risk premiums. This means that even without new unforeseen events, oil prices may be less likely to fall sharply due to "fixed expectations."
With the ban looming, diesel cracking prices are soaring, and the trade chain is being "rerouted."
If the support for crude oil comes from physical constraints, then the rise in refined oil prices is more driven by policy. Recently, the ICE diesel crack spread has strengthened again, rising to nearly $25 per barrel. This figure represents the profit a refinery can earn from processing one barrel of crude oil; its strengthening suggests that refined oil supply is tighter than crude oil supply, or that refinery supply is not flexible enough.
The core catalyst for this round of price increases is the new EU ban scheduled to take effect on January 21: prohibiting the import of refined petroleum products processed from Russian crude oil. Although the market had anticipated this and traders had adjusted their shipments in advance, the "timing effect" should not be underestimated. In the initial stages of the policy's implementation, increased friction costs due to logistics certification, compliance reviews, and changes in transportation routes may further drive up price volatility.
The most affected are the export chains of Indian refineries to Europe. It is understood that some Indian refineries are adjusting their crude oil procurement structures, attempting to maintain sales to Europe by blending non-Russian crude. While this move appears flexible, it actually raises compliance thresholds and marginal supply costs. More importantly, this "policy transmission" not only affects refined oil prices but also has a reverse effect on the crude oil market—the price differences between different grades and sources of crude oil may be restructured as a result.
Meanwhile, precious metals are also putting on a remarkable show. Gold has risen about 8% year-to-date, while silver has surged by 30%. Both are safe-haven assets, but the significant difference in their gains reflects their different attributes: gold is seen as a "steady-state hedging tool," while silver, due to its industrial applications, exhibits greater resilience during periods of loose liquidity and high sentiment.
Behind this surge, besides geopolitical factors such as escalating tensions between Europe and the US and the Greenland dispute, another underlying factor is emerging: frequent pressure from the US government on the Federal Reserve has raised concerns among investors about the central bank's independence. Once monetary policy is perceived as being subject to political interference, inflation expectations will derail, and the creditworthiness of government bonds will be questioned. In this environment, gold and silver become the preferred assets for hedging against "currency devaluation" and "systemic risks," thus reigniting the so-called "devaluation trading."
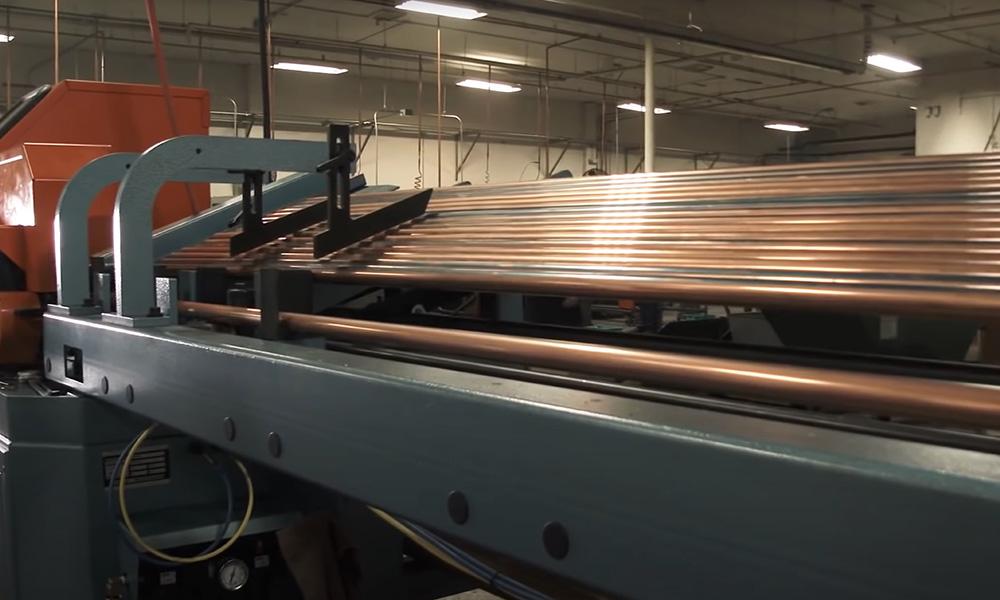
The copper market is undergoing a "distortion correction," with inventories rising from zero, sending a key signal.
Among industrial metals, copper's performance has been particularly noteworthy. The price rebound to nearly $13,000 per ton, seemingly driven by a recovery in demand, is actually more likely a result of market structural "self-correction." Previously, due to tariff expectations and inverted regional price differentials, a large influx of copper into the United States caused US warehouse inventories within the LME system to briefly reach zero, resulting in extreme regional tightness.
The situation has now reversed: the latest data shows that the warehouse's inventory has rebounded by 950 tons. Although the base was extremely low, the fact that it went from "zero" to "something" is a strong signal. This means that the previously distorted spot market structure is loosening. Why has this changed? The core reason is that the London Metal Exchange (LME) spot price is now higher than the near-month futures price on the New York Mercantile Exchange (COMEX), reversing last year's arbitrage logic.
In the past, higher COMEX prices attracted global copper flows to the United States; now, however, cross-market movement is no longer profitable, funds are flowing back to other regions, and inventories are recovering. This change indicates that the extreme imbalance in the copper market is gradually normalizing.
In summary, the current main theme in the commodity market is not a simple shift between a bull and bear market, but rather a structural rebalancing driven by a confluence of multiple forces. A weaker dollar provides bottom support, but the real driving forces come from tight spot markets, policy costs, and changes in cross-market price spreads. The key questions going forward are no longer "will commodities rise," but rather "which segment of the curve will break or recover first" and "which trade flows are quietly changing course."
- Risk Warning and Disclaimer
- The market involves risk, and trading may not be suitable for all investors. This article is for reference only and does not constitute personal investment advice, nor does it take into account certain users’ specific investment objectives, financial situation, or other needs. Any investment decisions made based on this information are at your own risk.