US-Iran negotiations limited upside potential for oil prices, leading to wide fluctuations in crude oil futures prices.
2026-02-06 00:36:22
WTI futures fell during the European session on Thursday (February 5) as reports surfaced that intermittent talks between the US and Iran had resumed. The two major powers reportedly agreed to hold talks in Oman on Friday. This news triggered a slight profit-taking in oil prices after a sharp rise the previous day, but did not completely eliminate hedging buying in anticipation of supply disruptions.

Diplomatic negotiations have been ongoing, leading to increased volatility in oil prices this week.
Oil prices fluctuated wildly this week: Prices initially plummeted on Monday after President Trump stated over the weekend that the US and Iran were in dialogue; however, on Wednesday, media reports that negotiations might break down caused prices to jump. This followed tensions in the Strait of Hormuz, where the US Navy shot down an Iranian drone.
Negotiations are ongoing, and the risk of military strike remains.
Despite the resumption of negotiations, markets are concerned that Trump may carry out his threat to strike Iran, potentially triggering a larger-scale conflict in the region.
If the Strait of Hormuz is blocked, oil prices could rise by $10-20.
If the US launches a strike against Iran, the conflict is highly likely to spread throughout the Middle East. As an OPEC member, Iran may block the Strait of Hormuz, preventing oil tankers from other OPEC oil-producing countries from leaving the area. Approximately 20% of global oil consumption relies on this waterway, impacting OPEC oil-producing nations such as Saudi Arabia, the UAE, Kuwait, and Iraq, potentially causing oil prices to rise by $10 to $20.
EIA data: Crude oil inventories fell more than expected.
News of US-Iran negotiations led to a slight decline in geopolitical risk premiums, but inventory data from the US Energy Information Administration (EIA) provided support for oil prices. For the week ending January 30, the EIA report showed that both crude oil and distillate fuel inventories declined, exceeding market expectations, while gasoline inventories increased during the same period.
Technical Analysis: The upward trend in US crude oil remains intact.
From the daily chart, the current main trend for US crude oil is upward. After hitting a low of $54.98, the price rebounded and is currently still in an upward structure.
If the price breaks through the resistance zone of $66.48-$66.60 (the previous high-density area), the strong upward trend will be reconfirmed; if it breaks down below the support level of $58.52, the main trend will turn downward.
Key support and pivot points
The core support range is $60.66-$59.29, which is further supported by the 50-day moving average ($59.37) and the 200-day moving average ($62.29), forming a dense support zone.
Short-term fluctuation range: $66.48-$61.12. Based on this, the key pivot level is calculated to be $63.80. The current oil price is near this pivot level, and the battle between bulls and bears is quite obvious.
Upward trend line dynamic support
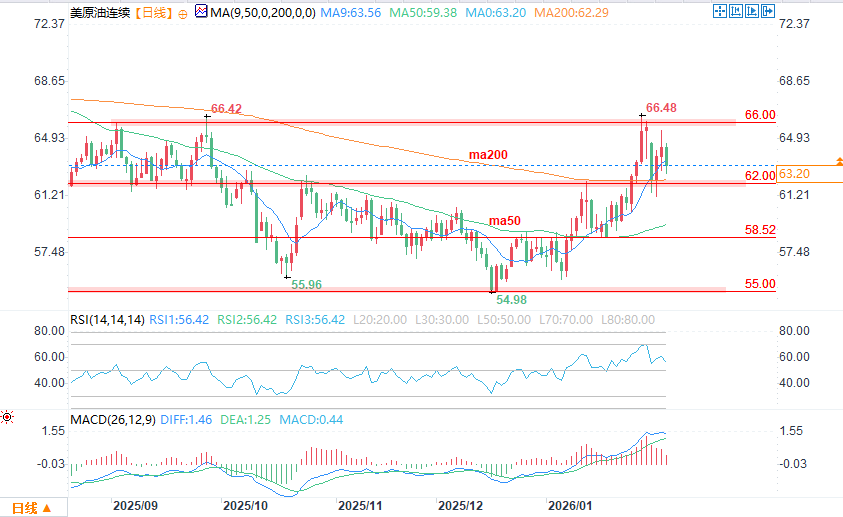
(WTI crude oil daily chart source: FX678)
The upward trendline formed from the low of $55.65 on January 7th is providing support at a rate of $0.36 per day, with the current dynamic support level at $62.85. This trendline is a crucial defense level for the short-term bulls; a decisive breach could trigger an accelerated pullback.
Market Outlook: US-Iran negotiations limit upside potential
With US-Iran negotiations continuing, the upside potential for oil prices will likely be limited to below the $66.48-$66.60 resistance zone. If the negotiations fail to make substantial progress by Friday, weakening market sentiment could push oil prices further down.
If oil prices break below the $62.85 trendline support, they may accelerate their decline towards the $60.66-$60.69 support zone, which combines the 50-day moving average and previous support levels, making it a key defensive area for the bulls.
Diplomatic negotiations have been ongoing, leading to increased volatility in oil prices this week.
Oil prices fluctuated wildly this week: Prices initially plummeted on Monday after President Trump stated over the weekend that the US and Iran were in dialogue; however, on Wednesday, media reports that negotiations might break down caused prices to jump. This followed tensions in the Strait of Hormuz, where the US Navy shot down an Iranian drone.
Negotiations are ongoing, and the risk of military strike remains.
Despite the resumption of negotiations, markets are concerned that Trump may carry out his threat to strike Iran, potentially triggering a larger-scale conflict in the region.
If the Strait of Hormuz is blocked, oil prices could rise by $10-20.
If the US launches a strike against Iran, the conflict is highly likely to spread throughout the Middle East. As an OPEC member, Iran may block the Strait of Hormuz, preventing oil tankers from other OPEC oil-producing countries from leaving the area. Approximately 20% of global oil consumption relies on this waterway, impacting OPEC oil-producing nations such as Saudi Arabia, the UAE, Kuwait, and Iraq, potentially causing oil prices to rise by $10 to $20.
EIA data: Crude oil inventories fell more than expected.
News of US-Iran negotiations led to a slight decline in geopolitical risk premiums, but inventory data from the US Energy Information Administration (EIA) provided support for oil prices. For the week ending January 30, the EIA report showed that both crude oil and distillate fuel inventories declined, exceeding market expectations, while gasoline inventories increased during the same period.
Technical Analysis: The upward trend in US crude oil remains intact.
From the daily chart, the current main trend for US crude oil is upward. After hitting a low of $54.98, the price rebounded and is currently still in an upward structure.
If the price breaks through the resistance zone of $66.48-$66.60 (the previous high-density area), the strong upward trend will be reconfirmed; if it breaks down below the support level of $58.52, the main trend will turn downward.
Key support and pivot points
The core support range is $60.66-$59.29, which is further supported by the 50-day moving average ($59.37) and the 200-day moving average ($62.29), forming a dense support zone.
Short-term fluctuation range: $66.48-$61.12. Based on this, the key pivot level is calculated to be $63.80. The current oil price is near this pivot level, and the battle between bulls and bears is quite obvious.
Upward trend line dynamic support
(WTI crude oil daily chart source: FX678)
The upward trendline formed from the low of $55.65 on January 7th is providing support at a rate of $0.36 per day, with the current dynamic support level at $62.85. This trendline is a crucial defense level for the short-term bulls; a decisive breach could trigger an accelerated pullback.
Market Outlook: US-Iran negotiations limit upside potential
With US-Iran negotiations continuing, the upside potential for oil prices will likely be limited to below the $66.48-$66.60 resistance zone. If the negotiations fail to make substantial progress by Friday, weakening market sentiment could push oil prices further down.
If oil prices break below the $62.85 trendline support, they may accelerate their decline towards the $60.66-$60.69 support zone, which combines the 50-day moving average and previous support levels, making it a key defensive area for the bulls.
- Risk Warning and Disclaimer
- The market involves risk, and trading may not be suitable for all investors. This article is for reference only and does not constitute personal investment advice, nor does it take into account certain users’ specific investment objectives, financial situation, or other needs. Any investment decisions made based on this information are at your own risk.