EUR/USD Weekly Outlook: Market Focuses on US Non-Farm Payroll Data
2026-02-09 18:34:41
Despite a broad-based rebound in risk assets last Friday, and a strong recovery for the euro/dollar pair from a key technical support level, the pair still closed lower for the second consecutive week. In the coming week, the euro/dollar's movement will likely be driven by the US jobs report due on Wednesday.
Why did the US dollar strengthen last week?
The dollar strengthened last week, mainly driven by market risk aversion, which suppressed stock, cryptocurrency, and precious metal prices for most of the week. It wasn't until bargain hunters entered the market on Friday that the dollar showed a lagging reaction to the slightly weak US labor market data released during the week.
Market Focus This Week
Last weekend, the market lowered its expectations for US interest rates, weakening the dollar's safe-haven rally. This could leave the dollar weak ahead of Wednesday's US jobs data release—the market generally expects non-farm payrolls to increase by about 70,000 jobs.
Meanwhile, the European Central Bank maintains a dovish stance on the current EUR/USD exchange rate level. If the employment data falls short of expectations or is not stronger than expected, the EUR/USD is likely to move back towards the 1.20 level. There are no major economic events to watch in the Eurozone this week.
EUR/USD Technical Weekly Outlook
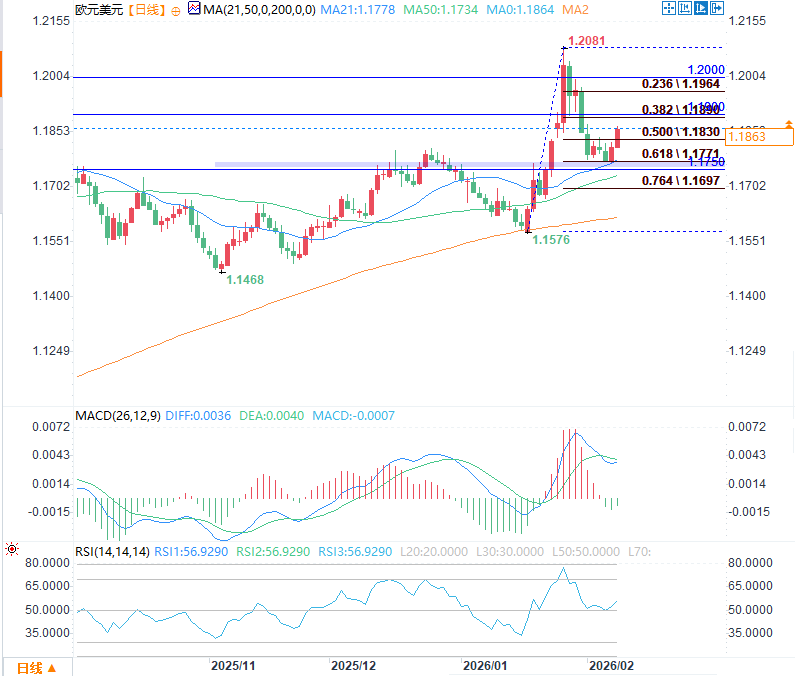
(EUR/USD daily chart source: FX678)
Last Friday, the EUR/USD daily chart closed with a bullish engulfing candlestick pattern, with the price finding precise support in the 1.1750–1.1765 range. This area previously acted as resistance and was also the breakout level around January 23.
The exchange rate also found support at the 21-day exponential moving average, which continues to rise and is clearly above the 200-day moving average, objectively confirming that the medium-term trend remains bullish.
Furthermore, the 61.8% Fibonacci retracement level of the January low of 1.1578 to the end-of-month high of 1.2083 is located around 1.1770; the current upward trend, which started in mid-January and peaked at the end of the month, has consistently held above this key Fibonacci level, further strengthening the technical support.
Key EUR/USD price levels to watch this week
The core question now is: what will be the next move of the exchange rate? On the upside, initial resistance is located around 1.1835, which corresponds to the low of the inverted hammer candlestick pattern from two weeks ago on the weekly chart. If the price breaks through this level, it means that the bears are gradually losing control, which may trigger short covering and push the exchange rate higher.
Above this level, further resistance lies in the 1.1900–1.1920 range; a break above this level would target the next psychological level at 1.2000, followed by the year’s high of 1.2083, which are the core short-term upside targets.
On the downside, if the key support level of 1.1750–1.1770 is breached, the exchange rate may test the 200-day moving average (currently around 1.1625); after breaking below this level, there will be no significant effective support until the 1.1500 level.
EUR/USD Outlook
Overall, the technical trend remains objectively bullish: the exchange rate has held above the major moving averages, and the structure of rising highs and lows is intact.
However, the next key directional move in the exchange rate may depend on the employment report released on Wednesday, which will be the core factor determining the short-term direction of the dollar.
Why did the US dollar strengthen last week?
The dollar strengthened last week, mainly driven by market risk aversion, which suppressed stock, cryptocurrency, and precious metal prices for most of the week. It wasn't until bargain hunters entered the market on Friday that the dollar showed a lagging reaction to the slightly weak US labor market data released during the week.
Market Focus This Week
Last weekend, the market lowered its expectations for US interest rates, weakening the dollar's safe-haven rally. This could leave the dollar weak ahead of Wednesday's US jobs data release—the market generally expects non-farm payrolls to increase by about 70,000 jobs.
Meanwhile, the European Central Bank maintains a dovish stance on the current EUR/USD exchange rate level. If the employment data falls short of expectations or is not stronger than expected, the EUR/USD is likely to move back towards the 1.20 level. There are no major economic events to watch in the Eurozone this week.
EUR/USD Technical Weekly Outlook
(EUR/USD daily chart source: FX678)
Last Friday, the EUR/USD daily chart closed with a bullish engulfing candlestick pattern, with the price finding precise support in the 1.1750–1.1765 range. This area previously acted as resistance and was also the breakout level around January 23.
The exchange rate also found support at the 21-day exponential moving average, which continues to rise and is clearly above the 200-day moving average, objectively confirming that the medium-term trend remains bullish.
Furthermore, the 61.8% Fibonacci retracement level of the January low of 1.1578 to the end-of-month high of 1.2083 is located around 1.1770; the current upward trend, which started in mid-January and peaked at the end of the month, has consistently held above this key Fibonacci level, further strengthening the technical support.
Key EUR/USD price levels to watch this week
The core question now is: what will be the next move of the exchange rate? On the upside, initial resistance is located around 1.1835, which corresponds to the low of the inverted hammer candlestick pattern from two weeks ago on the weekly chart. If the price breaks through this level, it means that the bears are gradually losing control, which may trigger short covering and push the exchange rate higher.
Above this level, further resistance lies in the 1.1900–1.1920 range; a break above this level would target the next psychological level at 1.2000, followed by the year’s high of 1.2083, which are the core short-term upside targets.
On the downside, if the key support level of 1.1750–1.1770 is breached, the exchange rate may test the 200-day moving average (currently around 1.1625); after breaking below this level, there will be no significant effective support until the 1.1500 level.
EUR/USD Outlook
Overall, the technical trend remains objectively bullish: the exchange rate has held above the major moving averages, and the structure of rising highs and lows is intact.
However, the next key directional move in the exchange rate may depend on the employment report released on Wednesday, which will be the core factor determining the short-term direction of the dollar.
- Risk Warning and Disclaimer
- The market involves risk, and trading may not be suitable for all investors. This article is for reference only and does not constitute personal investment advice, nor does it take into account certain users’ specific investment objectives, financial situation, or other needs. Any investment decisions made based on this information are at your own risk.