Gold's technical recovery is imminent, benefiting from both safe-haven demand and trade uncertainty.
2026-02-26 20:09:57
On Thursday (February 26, 2026), spot gold prices rose initially before falling back, eventually flat during the session. Safe-haven demand continued to support gold prices, boosted by both uncertainty surrounding US tariff policy and geopolitical risks associated with the US-Iran nuclear negotiations. Based on the 60-minute technical chart, the current price is likely to stabilize and rebound near multiple support zones, but it still faces resistance in the short term.

At 19:58 Beijing time, spot gold rose approximately 0.02% to $5164.71 per ounce (with an intraday trading range of approximately $5160-$5200). Gold prices previously touched a more than three-week high on Tuesday (near $5249) but subsequently retreated, currently testing the confluence of the lower channel line and a Fibonacci retracement level. COMEX April gold futures fell 0.84% to $5182.2, indicating slight divergence in the futures market, but overall risk aversion remains dominant.
Carlo Alberto de Casa, an external analyst at UBS, noted: "The ongoing tensions between the US and Iran, as well as the global economic uncertainty brought about by Trump's tariff policies, are catalysts for rising gold prices."
The third round of nuclear talks between the United States and Iran resumed today in Geneva, with US Special Envoy Steve Vitkov and Trump's son-in-law Jared Kushner representing the US in indirect talks with the Iranian delegation.
In his State of the Union address on Tuesday, Trump reiterated that Iran would not be allowed to possess nuclear weapons and referred to Iran as the "world's largest supporter of terrorism." Negotiations were seen as a "last chance" for diplomacy, but military pressure (the deployment of a carrier strike group in the Persian Gulf and F-22 fighter jets) continued. If talks break down, the risks in the Strait of Hormuz could push up oil prices and strengthen gold's safe-haven appeal.
Regarding tariffs, U.S. Trade Representative Jamison Greer stated on Wednesday that tariffs on some countries will be increased from the newly implemented 10% to 15% or higher (based on the Section 122 temporary import tariffs, effective February 24, exempting key minerals, energy, and pharmaceuticals). While specific partners were not identified, this move exacerbates global trade uncertainty, weakens the dollar, and benefits non-yielding assets like gold. Gold prices have risen approximately 20% this year, reaching a record high of $5594.82 on January 29.
Investors should also pay attention to the US weekly initial jobless claims data later today. Weak employment data could further weaken the dollar, which would be beneficial for gold. Overall, the short-term outlook is slightly bullish with some volatility, while the medium-term uptrend remains unchanged. Geopolitical and tariff uncertainties remain the main catalysts. It is recommended to adjust positions based on real-time negotiation progress and price breakout signals.
Technical Analysis
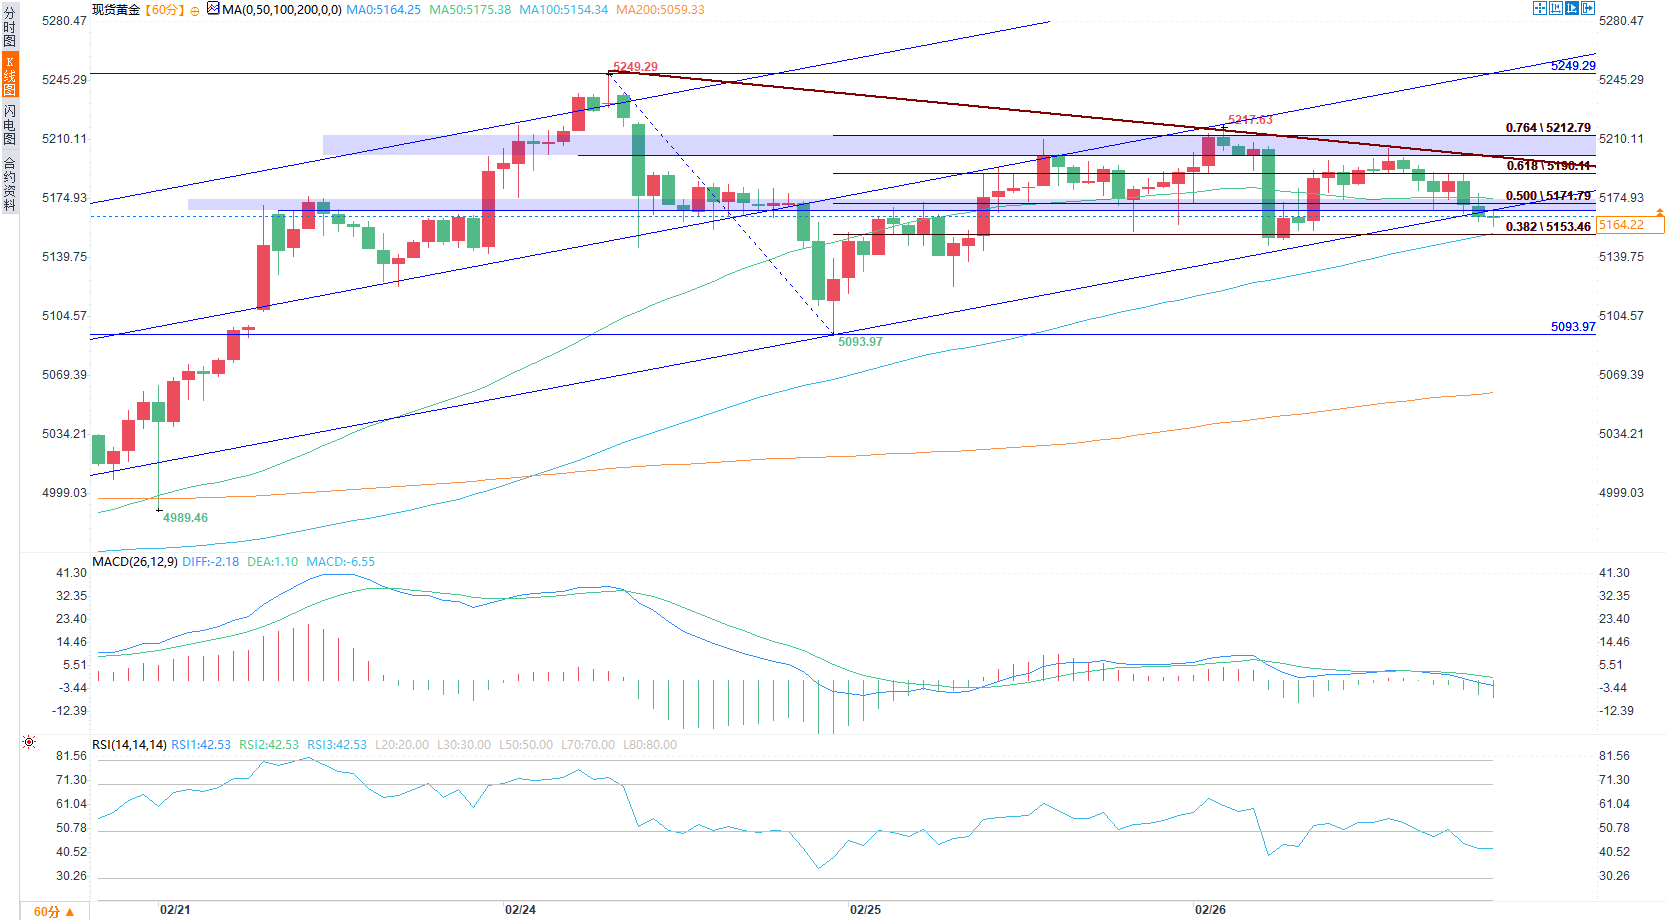
(Spot gold 1-hour chart source: EasyForex)
Looking at the current 60-minute chart, the technical pattern for spot gold is clear: the price has touched the lower trendline of the ascending channel (approximately $5093.97), a level that provides strong technical support. This, combined with the 0.5 Fibonacci retracement level (approximately $5171.79, calculated from the low of $4842.06 to the high of $5249.29) and the previous area of dense trading, forms a solid support level, suggesting a high probability of a short-term rebound.
Key support
The most direct approach: 0.5 Fibonacci retracement level ($5171.79) – a significant pullback level from the previous upward move, which many traders consider a watershed between bullish and bearish trends. It intersects with short-term moving averages (MA5/MA10) and is likely to trigger buying.
Secondly: The 100-day moving average (MA100) ($5152.78) represents the average holding cost in the medium term. Price action above this level confirms a bullish trend. A break below this level would increase the risk of a medium-term downtrend. The MA100 also coincides with the lower channel line, historically indicating a high probability of a rebound.
Further down: 0.382 Fibonacci retracement level ($5151.46) – almost coincides with the MA100, forming a dense support zone, the core defense line for the bulls, corresponding to the previous high trading volume.
Bottom line: Lower rail of the ascending channel ($5093.97) — the bottom line of the medium-term trend. If it is effectively broken, the ascending structure will be destroyed, and a deeper correction may follow.
The current price is oscillating widely between the 0.382 ($5151.46) and 0.764 ($5212.79) Fibonacci retracement levels, indicating a clear tug-of-war between bulls and bears. The chart shows a descending flag or triangle consolidation pattern, with low trading volume suggesting a consolidation phase. Conditions for a rebound: If the price stabilizes above multiple support levels (5170-5150 range), a MACD golden cross appears, and the RSI rises (currently around 43, neutral to weak but out of oversold territory), a small position can be initiated. The first target is the purple descending trendline (around 5200, a dense area of previous highs), where significant resistance is expected. Failure to break through this level will likely limit the rebound, leading to a return to oscillation. A break above 5200 would target the previous high of 5249.29, confirming the end of the pullback and opening up further upside potential. Conversely, if the support zone is breached, be wary of a deeper pullback or even a weakening trend.
At 19:58 Beijing time, spot gold rose approximately 0.02% to $5164.71 per ounce (with an intraday trading range of approximately $5160-$5200). Gold prices previously touched a more than three-week high on Tuesday (near $5249) but subsequently retreated, currently testing the confluence of the lower channel line and a Fibonacci retracement level. COMEX April gold futures fell 0.84% to $5182.2, indicating slight divergence in the futures market, but overall risk aversion remains dominant.
Carlo Alberto de Casa, an external analyst at UBS, noted: "The ongoing tensions between the US and Iran, as well as the global economic uncertainty brought about by Trump's tariff policies, are catalysts for rising gold prices."
The third round of nuclear talks between the United States and Iran resumed today in Geneva, with US Special Envoy Steve Vitkov and Trump's son-in-law Jared Kushner representing the US in indirect talks with the Iranian delegation.
In his State of the Union address on Tuesday, Trump reiterated that Iran would not be allowed to possess nuclear weapons and referred to Iran as the "world's largest supporter of terrorism." Negotiations were seen as a "last chance" for diplomacy, but military pressure (the deployment of a carrier strike group in the Persian Gulf and F-22 fighter jets) continued. If talks break down, the risks in the Strait of Hormuz could push up oil prices and strengthen gold's safe-haven appeal.
Regarding tariffs, U.S. Trade Representative Jamison Greer stated on Wednesday that tariffs on some countries will be increased from the newly implemented 10% to 15% or higher (based on the Section 122 temporary import tariffs, effective February 24, exempting key minerals, energy, and pharmaceuticals). While specific partners were not identified, this move exacerbates global trade uncertainty, weakens the dollar, and benefits non-yielding assets like gold. Gold prices have risen approximately 20% this year, reaching a record high of $5594.82 on January 29.
Investors should also pay attention to the US weekly initial jobless claims data later today. Weak employment data could further weaken the dollar, which would be beneficial for gold. Overall, the short-term outlook is slightly bullish with some volatility, while the medium-term uptrend remains unchanged. Geopolitical and tariff uncertainties remain the main catalysts. It is recommended to adjust positions based on real-time negotiation progress and price breakout signals.
Technical Analysis
(Spot gold 1-hour chart source: EasyForex)
Looking at the current 60-minute chart, the technical pattern for spot gold is clear: the price has touched the lower trendline of the ascending channel (approximately $5093.97), a level that provides strong technical support. This, combined with the 0.5 Fibonacci retracement level (approximately $5171.79, calculated from the low of $4842.06 to the high of $5249.29) and the previous area of dense trading, forms a solid support level, suggesting a high probability of a short-term rebound.
Key support
The most direct approach: 0.5 Fibonacci retracement level ($5171.79) – a significant pullback level from the previous upward move, which many traders consider a watershed between bullish and bearish trends. It intersects with short-term moving averages (MA5/MA10) and is likely to trigger buying.
Secondly: The 100-day moving average (MA100) ($5152.78) represents the average holding cost in the medium term. Price action above this level confirms a bullish trend. A break below this level would increase the risk of a medium-term downtrend. The MA100 also coincides with the lower channel line, historically indicating a high probability of a rebound.
Further down: 0.382 Fibonacci retracement level ($5151.46) – almost coincides with the MA100, forming a dense support zone, the core defense line for the bulls, corresponding to the previous high trading volume.
Bottom line: Lower rail of the ascending channel ($5093.97) — the bottom line of the medium-term trend. If it is effectively broken, the ascending structure will be destroyed, and a deeper correction may follow.
The current price is oscillating widely between the 0.382 ($5151.46) and 0.764 ($5212.79) Fibonacci retracement levels, indicating a clear tug-of-war between bulls and bears. The chart shows a descending flag or triangle consolidation pattern, with low trading volume suggesting a consolidation phase. Conditions for a rebound: If the price stabilizes above multiple support levels (5170-5150 range), a MACD golden cross appears, and the RSI rises (currently around 43, neutral to weak but out of oversold territory), a small position can be initiated. The first target is the purple descending trendline (around 5200, a dense area of previous highs), where significant resistance is expected. Failure to break through this level will likely limit the rebound, leading to a return to oscillation. A break above 5200 would target the previous high of 5249.29, confirming the end of the pullback and opening up further upside potential. Conversely, if the support zone is breached, be wary of a deeper pullback or even a weakening trend.
- Risk Warning and Disclaimer
- The market involves risk, and trading may not be suitable for all investors. This article is for reference only and does not constitute personal investment advice, nor does it take into account certain users’ specific investment objectives, financial situation, or other needs. Any investment decisions made based on this information are at your own risk.