The outbreak in the Middle East sent shockwaves through the dollar and gold markets! US Treasury yields hit an 11-month low; watch for a potential market reversal tonight.
2026-03-02 19:55:18
On Monday (March 2), financial markets continued the sharp fluctuations of the previous night. Spot gold remained above $5390 per ounce, the US dollar index held steady around 98.30, and the yield on the 10-year US Treasury bond hovered around 3.96%. Monday saw a repricing of geopolitical risk premiums: US Treasury yields hit an 11-month low during the session, gold surged more than 2%, and the US dollar index returned above 98.50. The core driver of this market movement has shifted from traditional monetary policy expectations to safe-haven demand and energy supply concerns stemming from escalating tensions in the Middle East.

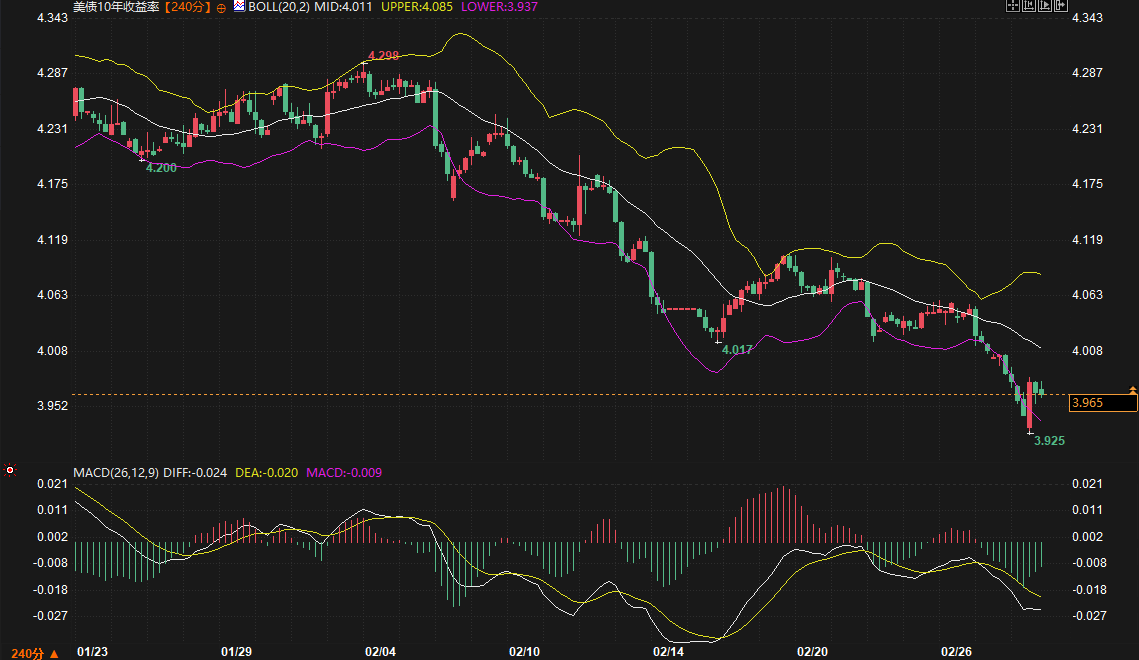
The US Treasury market exhibited typical risk-averse characteristics on Monday, but the internal structural divergence reveals deeper trading logic. The 10-year Treasury yield fell to 3.926% intraday, a new low since April 2025, and the 240-minute chart shows it has broken below the key technical support level of 3.965%. Technically, the Bollinger Bands (BOLL) are narrowing, and the price continues to graze the lower band (3.937%), indicating that volatility is converging but downward pressure has not yet been fully released. While the MACD indicator's DIFF and DEA are still in negative territory, the histogram continues to shrink, suggesting that bearish momentum is weakening, but a trend reversal signal has not yet been established.
Of particular note is the steepening of the yield curve. The 2-year Treasury yield actually rose 3 basis points to 3.41% on Monday, narrowing the 2s/10s spread to around 55 basis points. This structure reflects that the market is simultaneously pricing in two logics: front-end yields are constrained by expectations of Federal Reserve policy—the likelihood of a rate cut in 2026 is further decreasing; while long-end yields are suppressed by safe-haven inflows. Analysts from well-known institutions point out that geopolitical conflicts are transmitted to inflation expectations through energy prices, posing a stagflation risk to economies reliant on oil imports (such as Japan and the Eurozone), while the relative advantage of the US as a net exporter supports the dollar.
The performance of the Japanese government bond market provides evidence of cross-border transmission. The yield on 10-year Japanese government bonds fell 5 basis points to 2.06% on Monday, while the 30-year yield dropped 5.5 basis points to 3.28%. Market participants observed that Japanese investors did not rush to sell during the yield decline; instead, there may have been demand for longer-duration allocations. This cross-market risk aversion linkage strengthened the buying base for US Treasuries.
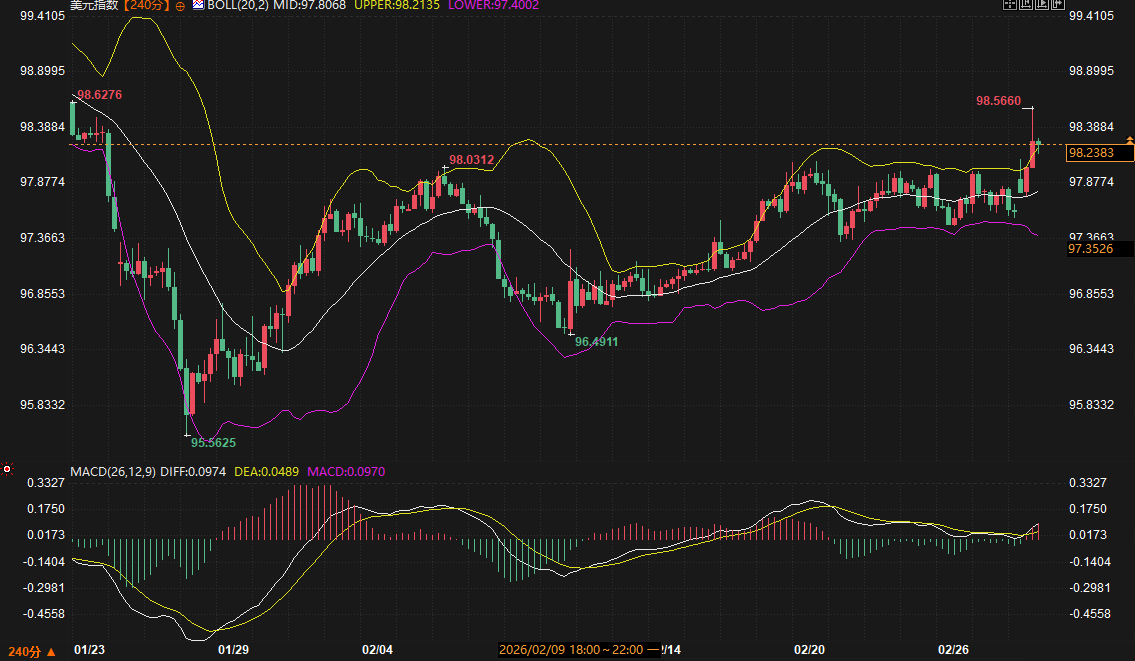
The US dollar index rose 0.74% to 98.37 on Monday, hitting a new high since January 23 at 98.566 during the session. Observing the 240-minute candlestick chart, the dollar index has remained within the 95.56-98.63 range. Currently, the price is holding above the Bollinger Band middle line (97.80) and between the middle and upper bands. The MACD indicator's DIFF line crossed above the DEA line, and the histogram turned positive, indicating strengthening short-term momentum. However, the driving logic behind this round of dollar appreciation has changed: it is no longer simply driven by risk aversion, but rather by structural divergence resulting from the impact of energy price shocks.
A Barclays analyst model suggests that a 10% rise in oil prices could support a 0.5%-1% strengthening of the US dollar index. The core of this transmission mechanism lies in the asymmetric impact of the US's energy independence. The Eurozone and Japan are highly dependent on crude oil imports, and Brent crude briefly broke through $82 per barrel, directly worsening the terms of trade for both regions. The euro fell 0.80% against the dollar to 1.1721 on Monday, hitting a new low since January 22 at 1.1698. The German Economic Review points out that every $15 per barrel increase in oil prices could push up Eurozone consumer prices by nearly 0.5 percentage points, thereby eroding real income.
The yen's movements are even more telling. The dollar rose 0.61% against the yen to 157.005, hitting a high of 157.25 during the session, its highest level since February 9. The remarks of Bank of Japan Deputy Governor Ryozo Himino are noteworthy: on the one hand, he stated that monetary policy would remain accommodative, while on the other hand, he emphasized that market fluctuations should not be mechanically linked to policy decisions. Behind this ambiguous statement lies the constraint that rising energy import costs are limiting the Bank of Japan's room for interest rate hikes. Strategists at BNY Mellon pointed out that energy supply shocks pose a serious challenge to the Bank of Japan and could disrupt the established coordination of fiscal and monetary policies.
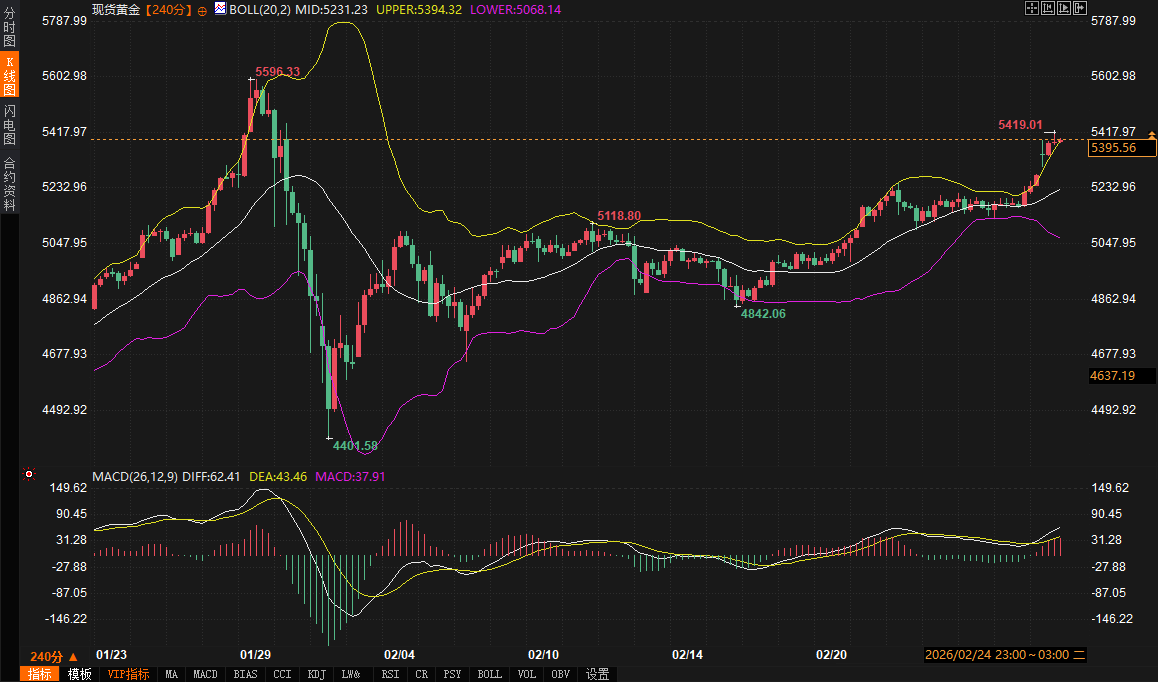
Spot gold rose 2.1% to $5,390.38 per ounce on Monday, hitting a new high since January 29 at $5,594.82 during the session. The 240-minute chart shows that gold encountered short-term resistance near $5,419.01, but generally remained within the $4,401.58-$5,596.33 trading range. Technical indicators are mixed: the upper Bollinger Band at $5,394.36 provides short-term resistance, while the middle band at $5,231.24 offers key support; although the MACD indicator maintains a bullish alignment, the DIFF and DEA lines are narrowing, and the histogram at 37.93 indicates weakening upward momentum.
However, the core logic of current gold trading has shifted from the traditional real interest rate framework to the geopolitical risk transmission mechanism. While declining US Treasury yields typically benefit gold, the simultaneous strengthening of both in this round of market movements warrants further investigation—reflecting the cross-asset diffusion of safe-haven demand. Analysts at Julius Baer point out that the current highly uncertain situation further strengthens gold's safe-haven appeal, providing portfolio stability during periods of heightened financial market volatility.
More noteworthy is the correlation between gold and crude oil prices. On Monday, gold and Brent crude oil both saw a rare and significant increase in the same direction, which carries special significance against the backdrop of escalating tensions in the Middle East: the market is pricing in the risk of stagflation due to attacks on energy facilities. A joint statement from the French, German, and British governments expressing concern over Iran's actions, and their preparedness to take defensive action to destroy Iran's missile and drone launch capabilities, suggests the possibility of further escalation of the conflict.
The afternoon's trading in the Japanese market provided time-series evidence of risk transmission: Japanese government bond futures resumed their upward trend after the secretary of Iran's Supreme National Security Council stated that Iran would not negotiate with the United States, and this shift in risk sentiment was simultaneously reflected in gold buying. BNP Paribas last week raised its 2026 average gold price forecast by 27% to $5,620 per ounce and expects it to potentially break through $6,250 by the end of the year, based on the continued existence of macroeconomic and geopolitical uncertainties.
Looking ahead to the next two trading days, the market will move amidst a dual rhythm of geopolitical developments and economic data releases. Key technical and fundamental levels are as follows:
Spot gold (XAU/USD)
- Support range: $5231-$5250 (the area where the 240-minute Bollinger Band middle line coincides with the psychological level)
- Resistance range: $5419-$5440 (previous resistance level and psychological barrier)
- Key points to watch during the trading session: Evolution of risk aversion during the European and American sessions, and further news regarding shipping in the Strait of Hormuz during the New York session.
US Dollar Index (DXY)
- Support range: 97.80-98.00 (240-minute Bollinger Band middle line and previous high turned support)
- Resistance range: 98.63-98.80 (previous high and psychological level)
- Key focus during the session: US ADP employment data and market expectations in the early New York session (previous data suggests the resilience of the job market may strengthen the dollar).
US 10-year Treasury yield (US10Y)
- Support range: 3.92%-3.93% (the area where Monday's low coincides with the lower Bollinger Band)
- Resistance range: 3.98%-4.00% (psychological level and hourly moving average resistance)
- Key points to watch during trading hours: Demand for the 10-year Treasury auction early Wednesday morning, and investor trends in cross-border allocation of US Treasuries.
The upcoming US economic data this week (ADP, initial jobless claims, and non-farm payrolls) will be a litmus test for market reaction mechanisms. If the data shows resilience, it may strengthen expectations that the Federal Reserve will maintain high interest rates, which would offset risk aversion; if the data is unexpectedly weak, it may further strengthen the logic of safe-haven trading. However, the core variable remains the pace of development in the Middle East—whether it tends towards easing or spirals upwards—which will determine the depth and sustainability of the current asset price revaluation.
The flattening US Treasury yield curve: a battle between safe-haven buying and inflation expectations.
The US Treasury market exhibited typical risk-averse characteristics on Monday, but the internal structural divergence reveals deeper trading logic. The 10-year Treasury yield fell to 3.926% intraday, a new low since April 2025, and the 240-minute chart shows it has broken below the key technical support level of 3.965%. Technically, the Bollinger Bands (BOLL) are narrowing, and the price continues to graze the lower band (3.937%), indicating that volatility is converging but downward pressure has not yet been fully released. While the MACD indicator's DIFF and DEA are still in negative territory, the histogram continues to shrink, suggesting that bearish momentum is weakening, but a trend reversal signal has not yet been established.
Of particular note is the steepening of the yield curve. The 2-year Treasury yield actually rose 3 basis points to 3.41% on Monday, narrowing the 2s/10s spread to around 55 basis points. This structure reflects that the market is simultaneously pricing in two logics: front-end yields are constrained by expectations of Federal Reserve policy—the likelihood of a rate cut in 2026 is further decreasing; while long-end yields are suppressed by safe-haven inflows. Analysts from well-known institutions point out that geopolitical conflicts are transmitted to inflation expectations through energy prices, posing a stagflation risk to economies reliant on oil imports (such as Japan and the Eurozone), while the relative advantage of the US as a net exporter supports the dollar.
The performance of the Japanese government bond market provides evidence of cross-border transmission. The yield on 10-year Japanese government bonds fell 5 basis points to 2.06% on Monday, while the 30-year yield dropped 5.5 basis points to 3.28%. Market participants observed that Japanese investors did not rush to sell during the yield decline; instead, there may have been demand for longer-duration allocations. This cross-market risk aversion linkage strengthened the buying base for US Treasuries.
Structural support for the US dollar index: Reconstruction of energy premium and interest rate differential advantage
The US dollar index rose 0.74% to 98.37 on Monday, hitting a new high since January 23 at 98.566 during the session. Observing the 240-minute candlestick chart, the dollar index has remained within the 95.56-98.63 range. Currently, the price is holding above the Bollinger Band middle line (97.80) and between the middle and upper bands. The MACD indicator's DIFF line crossed above the DEA line, and the histogram turned positive, indicating strengthening short-term momentum. However, the driving logic behind this round of dollar appreciation has changed: it is no longer simply driven by risk aversion, but rather by structural divergence resulting from the impact of energy price shocks.
A Barclays analyst model suggests that a 10% rise in oil prices could support a 0.5%-1% strengthening of the US dollar index. The core of this transmission mechanism lies in the asymmetric impact of the US's energy independence. The Eurozone and Japan are highly dependent on crude oil imports, and Brent crude briefly broke through $82 per barrel, directly worsening the terms of trade for both regions. The euro fell 0.80% against the dollar to 1.1721 on Monday, hitting a new low since January 22 at 1.1698. The German Economic Review points out that every $15 per barrel increase in oil prices could push up Eurozone consumer prices by nearly 0.5 percentage points, thereby eroding real income.
The yen's movements are even more telling. The dollar rose 0.61% against the yen to 157.005, hitting a high of 157.25 during the session, its highest level since February 9. The remarks of Bank of Japan Deputy Governor Ryozo Himino are noteworthy: on the one hand, he stated that monetary policy would remain accommodative, while on the other hand, he emphasized that market fluctuations should not be mechanically linked to policy decisions. Behind this ambiguous statement lies the constraint that rising energy import costs are limiting the Bank of Japan's room for interest rate hikes. Strategists at BNY Mellon pointed out that energy supply shocks pose a serious challenge to the Bank of Japan and could disrupt the established coordination of fiscal and monetary policies.
Gold's unique pricing logic: from real interest rates to geopolitical risk transmission
Spot gold rose 2.1% to $5,390.38 per ounce on Monday, hitting a new high since January 29 at $5,594.82 during the session. The 240-minute chart shows that gold encountered short-term resistance near $5,419.01, but generally remained within the $4,401.58-$5,596.33 trading range. Technical indicators are mixed: the upper Bollinger Band at $5,394.36 provides short-term resistance, while the middle band at $5,231.24 offers key support; although the MACD indicator maintains a bullish alignment, the DIFF and DEA lines are narrowing, and the histogram at 37.93 indicates weakening upward momentum.
However, the core logic of current gold trading has shifted from the traditional real interest rate framework to the geopolitical risk transmission mechanism. While declining US Treasury yields typically benefit gold, the simultaneous strengthening of both in this round of market movements warrants further investigation—reflecting the cross-asset diffusion of safe-haven demand. Analysts at Julius Baer point out that the current highly uncertain situation further strengthens gold's safe-haven appeal, providing portfolio stability during periods of heightened financial market volatility.
More noteworthy is the correlation between gold and crude oil prices. On Monday, gold and Brent crude oil both saw a rare and significant increase in the same direction, which carries special significance against the backdrop of escalating tensions in the Middle East: the market is pricing in the risk of stagflation due to attacks on energy facilities. A joint statement from the French, German, and British governments expressing concern over Iran's actions, and their preparedness to take defensive action to destroy Iran's missile and drone launch capabilities, suggests the possibility of further escalation of the conflict.
The afternoon's trading in the Japanese market provided time-series evidence of risk transmission: Japanese government bond futures resumed their upward trend after the secretary of Iran's Supreme National Security Council stated that Iran would not negotiate with the United States, and this shift in risk sentiment was simultaneously reflected in gold buying. BNP Paribas last week raised its 2026 average gold price forecast by 27% to $5,620 per ounce and expects it to potentially break through $6,250 by the end of the year, based on the continued existence of macroeconomic and geopolitical uncertainties.
Key range and points to watch in the next 2-3 days
Looking ahead to the next two trading days, the market will move amidst a dual rhythm of geopolitical developments and economic data releases. Key technical and fundamental levels are as follows:
Spot gold (XAU/USD)
- Support range: $5231-$5250 (the area where the 240-minute Bollinger Band middle line coincides with the psychological level)
- Resistance range: $5419-$5440 (previous resistance level and psychological barrier)
- Key points to watch during the trading session: Evolution of risk aversion during the European and American sessions, and further news regarding shipping in the Strait of Hormuz during the New York session.
US Dollar Index (DXY)
- Support range: 97.80-98.00 (240-minute Bollinger Band middle line and previous high turned support)
- Resistance range: 98.63-98.80 (previous high and psychological level)
- Key focus during the session: US ADP employment data and market expectations in the early New York session (previous data suggests the resilience of the job market may strengthen the dollar).
US 10-year Treasury yield (US10Y)
- Support range: 3.92%-3.93% (the area where Monday's low coincides with the lower Bollinger Band)
- Resistance range: 3.98%-4.00% (psychological level and hourly moving average resistance)
- Key points to watch during trading hours: Demand for the 10-year Treasury auction early Wednesday morning, and investor trends in cross-border allocation of US Treasuries.
The upcoming US economic data this week (ADP, initial jobless claims, and non-farm payrolls) will be a litmus test for market reaction mechanisms. If the data shows resilience, it may strengthen expectations that the Federal Reserve will maintain high interest rates, which would offset risk aversion; if the data is unexpectedly weak, it may further strengthen the logic of safe-haven trading. However, the core variable remains the pace of development in the Middle East—whether it tends towards easing or spirals upwards—which will determine the depth and sustainability of the current asset price revaluation.
- Risk Warning and Disclaimer
- The market involves risk, and trading may not be suitable for all investors. This article is for reference only and does not constitute personal investment advice, nor does it take into account certain users’ specific investment objectives, financial situation, or other needs. Any investment decisions made based on this information are at your own risk.