From being disliked to being snapped up: How did the US dollar achieve its "return to glory"?
2026-03-02 19:59:03
On Monday, March 2nd, the US dollar index strengthened across the board, trading around 98.30 during the European session, maintaining its firm stance. The core driver of this sharp fluctuation stemmed from the market's deep digestion of the escalating geopolitical conflict between the US and Iran. However, since last year, in most risk events, the US dollar has not become the preferred safe haven for funds as it once was, and even the traditional safe-haven currency, the Japanese yen, has failed to dominate; instead, the Swiss franc has temporarily taken over the defensive role.
Behind this lies both internal administrative turmoil in the United States and policy uncertainty stemming from political changes in Japan. However, the current US-Iran situation has changed the game, leading to the return of the US dollar and its reclaiming of its title as the "king of safe havens." Analysts believe this shift is not accidental, but rather a primal market response to extreme uncertainty, driven by a desire for liquidity and payment capabilities. As tensions rise, the complex logic of the past is simplified to the most basic survival rule: hold the most widely accepted currency to weather any potential storm.
The core logic behind the dollar's recent dominance lies in the strong return of the "petrodollar" mechanism. Despite persistent calls for de-dollarization globally, the harsh reality is that the vast majority of global oil transactions are still priced and settled in US dollars. This structural fact constitutes a protective barrier for the dollar's exchange rate.
More importantly, the unique aspect of this Middle East geopolitical escalation lies in its anticipated persistence. The baseline scenario indicates that tensions could persist for weeks, with the key variable being the navigability of the Strait of Hormuz. If this vital energy artery is blocked, major global oil importers must immediately stockpile large amounts of US dollars to cope with potential supply disruptions and price spikes. Given the substantial short positions accumulated in the US dollar before the conflict, these short positions were forced to close out in the face of this sudden geopolitical black swan event, further exacerbating the dollar's upward momentum. This is not merely a simple speculative act, but a natural reaction of the underlying logic of the global trade system during a crisis.
High oil prices have not only boosted demand for the US dollar but also had a profound spillover effect on US monetary policy. Even if the impact of geopolitical conflicts is considered temporary, the resulting inflationary pressures are enough to make the Federal Reserve cautious about further interest rate cuts until the dust settles. Currently, while the market pricing for the Fed has not undergone a radical change, the pace has clearly slowed. Traders are still pricing in a rate cut of about 57 basis points by the end of the year, with the next full 25 basis point cut expected in September, while the probability of a rate cut in July has now fallen to around 91%.
This slight adjustment in data reflects a deep-seated anxiety in the market: if the situation in the Middle East continues and energy prices remain high, the risk of a rebound in inflation will force the Federal Reserve to hold off on interest rates. Analysts point out that while the market generally expects the easing cycle to remain unchanged, the timing of the specific easing measures has become more precarious. High oil prices are like a Damocles' sword hanging over the Fed's head; any news of a deteriorating situation could instantly reverse interest rate expectations. Against this macroeconomic backdrop, the US dollar has not only gained the support of its safe-haven status but also benefited from interest rate differential expectations, creating a situation of double positive impact.
Leaving aside complex macroeconomic narratives, from a purely technical perspective, the US dollar index daily chart has issued a clear bullish signal. The current price is standing at the upper end of the recent trading range, demonstrating strong rebound momentum. The chart clearly shows that the index successfully stabilized and rebounded after touching a low of 95.5660. The MACD indicator shows a golden cross upward trend, with the DIFF line at 0.0320, the DEA line at -0.0931, and the MACD histogram at 0.2501, indicating that bullish momentum is significantly strengthening. Meanwhile, the RSI indicator is at 59, in the neutral-to-strong zone, and has not yet entered the overbought zone, meaning that there is still room for upward movement, and the bulls still have room to exert their strength.
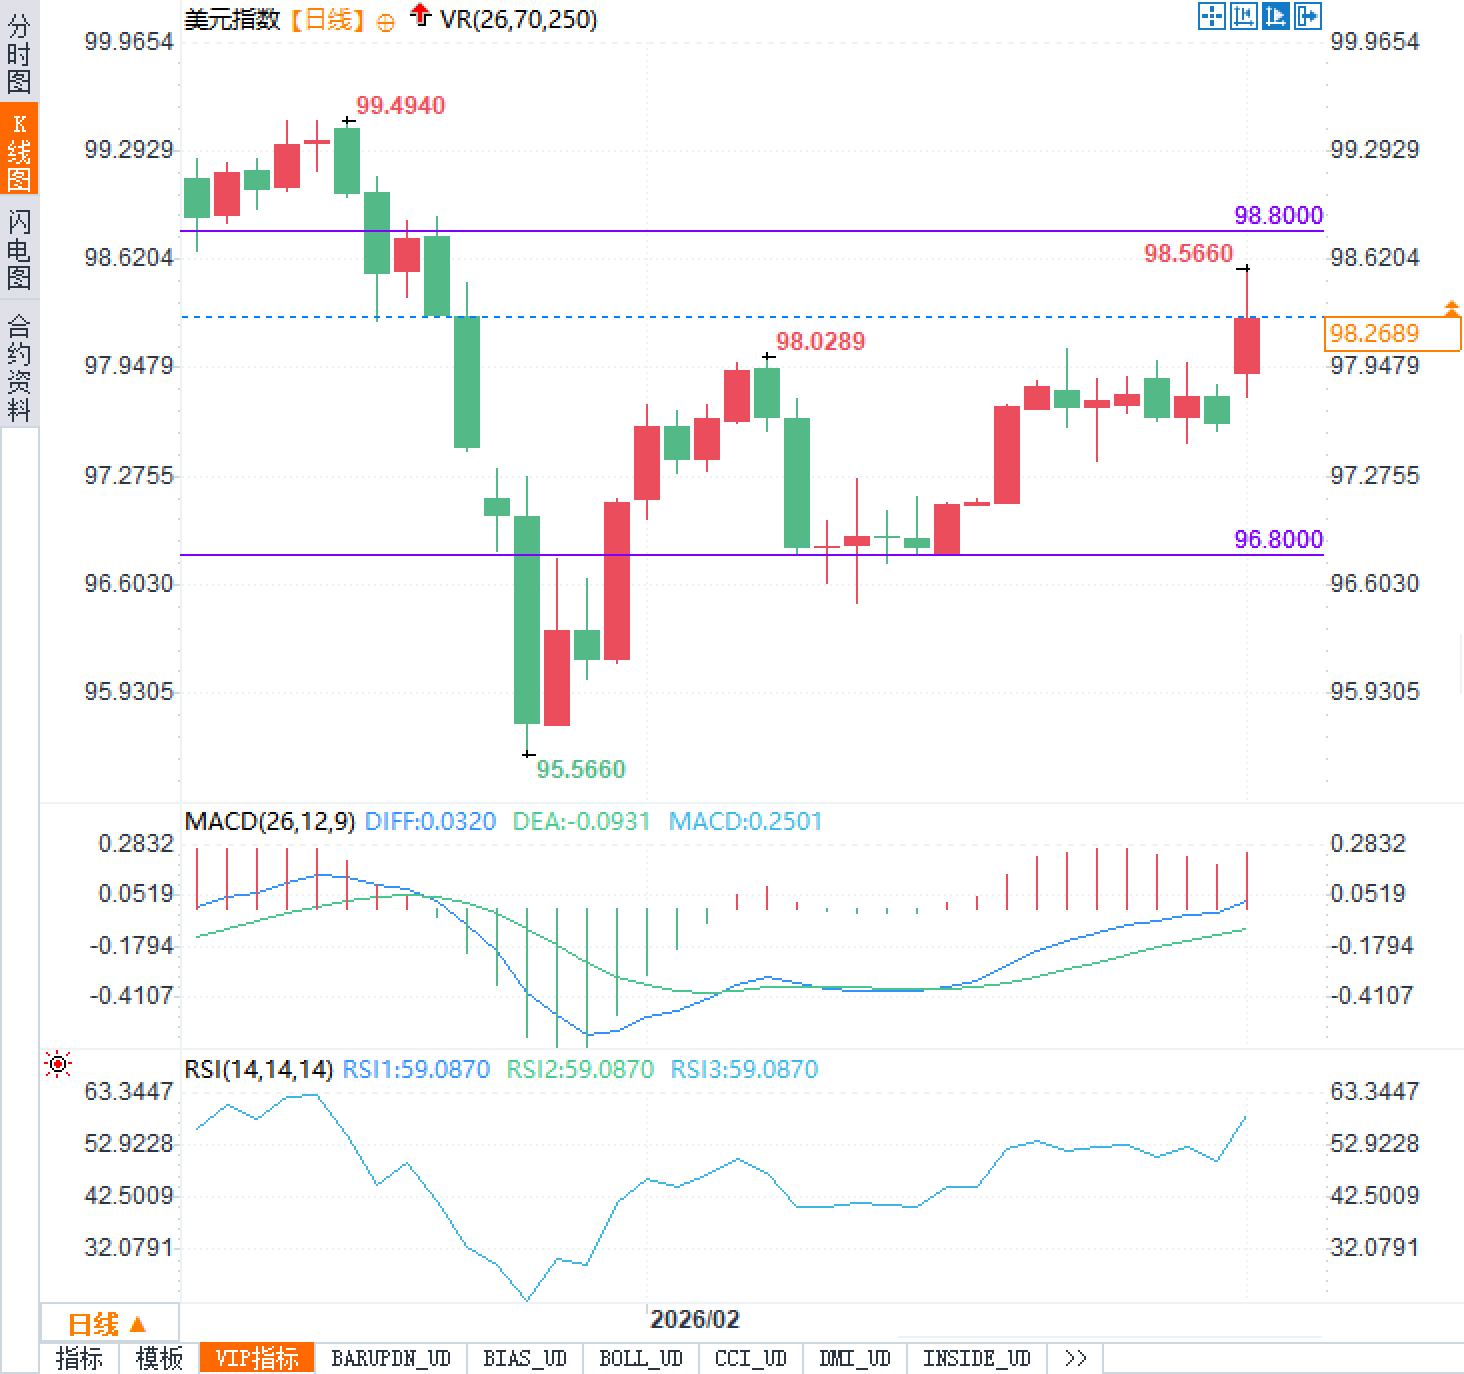
Looking ahead, the key resistance level to watch is 98.8000. A successful break above this level could see the index challenge the previous high of 99.4940. Support is seen around the 96.8000 level. Supported by both geopolitical risk premiums and demand for petrodollars, the analysis suggests the US dollar index is likely to maintain a strong, volatile pattern in the short term. However, the market's ultimate direction depends on the latest developments in the Middle East and subsequent statements from Federal Reserve officials. Until Washington's next move, the reactions of Gulf states, and the outcome of the global power struggle are clear, this currency storm triggered by geopolitical conflict is unlikely to subside easily.
Behind this lies both internal administrative turmoil in the United States and policy uncertainty stemming from political changes in Japan. However, the current US-Iran situation has changed the game, leading to the return of the US dollar and its reclaiming of its title as the "king of safe havens." Analysts believe this shift is not accidental, but rather a primal market response to extreme uncertainty, driven by a desire for liquidity and payment capabilities. As tensions rise, the complex logic of the past is simplified to the most basic survival rule: hold the most widely accepted currency to weather any potential storm.
Currency game behind soaring oil prices
The core logic behind the dollar's recent dominance lies in the strong return of the "petrodollar" mechanism. Despite persistent calls for de-dollarization globally, the harsh reality is that the vast majority of global oil transactions are still priced and settled in US dollars. This structural fact constitutes a protective barrier for the dollar's exchange rate.
More importantly, the unique aspect of this Middle East geopolitical escalation lies in its anticipated persistence. The baseline scenario indicates that tensions could persist for weeks, with the key variable being the navigability of the Strait of Hormuz. If this vital energy artery is blocked, major global oil importers must immediately stockpile large amounts of US dollars to cope with potential supply disruptions and price spikes. Given the substantial short positions accumulated in the US dollar before the conflict, these short positions were forced to close out in the face of this sudden geopolitical black swan event, further exacerbating the dollar's upward momentum. This is not merely a simple speculative act, but a natural reaction of the underlying logic of the global trade system during a crisis.
The Federal Reserve, under the shadow of inflation: Expectations for interest rate cuts abruptly halted.
High oil prices have not only boosted demand for the US dollar but also had a profound spillover effect on US monetary policy. Even if the impact of geopolitical conflicts is considered temporary, the resulting inflationary pressures are enough to make the Federal Reserve cautious about further interest rate cuts until the dust settles. Currently, while the market pricing for the Fed has not undergone a radical change, the pace has clearly slowed. Traders are still pricing in a rate cut of about 57 basis points by the end of the year, with the next full 25 basis point cut expected in September, while the probability of a rate cut in July has now fallen to around 91%.
This slight adjustment in data reflects a deep-seated anxiety in the market: if the situation in the Middle East continues and energy prices remain high, the risk of a rebound in inflation will force the Federal Reserve to hold off on interest rates. Analysts point out that while the market generally expects the easing cycle to remain unchanged, the timing of the specific easing measures has become more precarious. High oil prices are like a Damocles' sword hanging over the Fed's head; any news of a deteriorating situation could instantly reverse interest rate expectations. Against this macroeconomic backdrop, the US dollar has not only gained the support of its safe-haven status but also benefited from interest rate differential expectations, creating a situation of double positive impact.
Technical Breakthrough and Future Outlook: Can the Bullish Momentum Continue?
Leaving aside complex macroeconomic narratives, from a purely technical perspective, the US dollar index daily chart has issued a clear bullish signal. The current price is standing at the upper end of the recent trading range, demonstrating strong rebound momentum. The chart clearly shows that the index successfully stabilized and rebounded after touching a low of 95.5660. The MACD indicator shows a golden cross upward trend, with the DIFF line at 0.0320, the DEA line at -0.0931, and the MACD histogram at 0.2501, indicating that bullish momentum is significantly strengthening. Meanwhile, the RSI indicator is at 59, in the neutral-to-strong zone, and has not yet entered the overbought zone, meaning that there is still room for upward movement, and the bulls still have room to exert their strength.
Looking ahead, the key resistance level to watch is 98.8000. A successful break above this level could see the index challenge the previous high of 99.4940. Support is seen around the 96.8000 level. Supported by both geopolitical risk premiums and demand for petrodollars, the analysis suggests the US dollar index is likely to maintain a strong, volatile pattern in the short term. However, the market's ultimate direction depends on the latest developments in the Middle East and subsequent statements from Federal Reserve officials. Until Washington's next move, the reactions of Gulf states, and the outcome of the global power struggle are clear, this currency storm triggered by geopolitical conflict is unlikely to subside easily.
- Risk Warning and Disclaimer
- The market involves risk, and trading may not be suitable for all investors. This article is for reference only and does not constitute personal investment advice, nor does it take into account certain users’ specific investment objectives, financial situation, or other needs. Any investment decisions made based on this information are at your own risk.