Japanese bond yields have surged, so why is the yen still falling? The USD/JPY exchange rate has peaked at 157.8; it remains to be seen whether the authorities will intervene!
2026-03-03 17:56:50
Table of Contents
- Japanese bond yields and inflation concerns
- Strong technical characteristics
- Potential impact of intervention risks
- Support and resistance range prediction
- Future Trend Outlook
On Tuesday (March 3), the USD/JPY exchange rate was last quoted at 157.699, having touched around 157.817 during the session, continuing its recent upward trend. Japanese government bond yields rose across the board on the same day, with the benchmark 10-year yield climbing to 2.12%, an increase of 6 basis points from the previous trading day, reflecting a shift in market pricing from the ongoing Middle East conflict to inflationary pressures. This background is directly related to the yen's exchange rate movement, and authorities have simultaneously increased their monitoring of market fluctuations.
Japanese bond yields and inflation concerns
Japanese government bond futures opened at 132.81 on Tuesday, down 43 points from the previous close. They rebounded briefly to 132.91 in the morning session before falling back again. Selling pressure was mainly concentrated on 10-year bonds and less actively traded ultra-long-term bonds. The afternoon Asian session saw a simultaneous rise in US Treasury yields, further exacerbating the sell-off. The 10-year bond auction results were generally in line with expectations. The reopened JB381 lot closed at 2.129%, a final 0.7 basis points, with a bid-to-cover ratio of 3.30, higher than the previous auction's 3.02, but lower than the average of the past six auctions at 3.36.
Notably, significant selling pressure also emerged on 25-year inactive bonds. Previously, the market had anticipated that large life insurers would reduce their sales of low-yield bonds due to accounting guidance adjustments. However, recent news indicates that a major Japanese life insurer will continue to replace low-yield bonds with higher-yielding 30-year bonds and use equity investment gains to hedge against bond losses. This development exceeded some participants' expectations, putting downward pressure on long-term yields.
The rise in Japanese government bond yields is directly related to the escalating conflict in the Middle East. The weekend's US-Israeli attacks on Iran were initially seen as a safe-haven event, prompting funds to buy Japanese government bonds to cover short positions. However, the continued hostilities have turned to concerns about inflationary pressures in energy-importing countries. Potential responses from central banks have further reinforced this expectation. As a net energy importer, Japan's monetary policy space is indirectly affected. With the yield curve steepening overall, if inflation expectations remain high in the short term, selling pressure on Japanese government bonds may continue into subsequent trading days.
This fundamental shift resonated with the USD/JPY exchange rate. Higher domestic yields theoretically support the yen, but under the current inflation-driven logic, funds are more inclined to seek dollar assets, putting pressure on the yen. This correlation provides a clear window into future exchange rate movements.
Strong technical characteristics
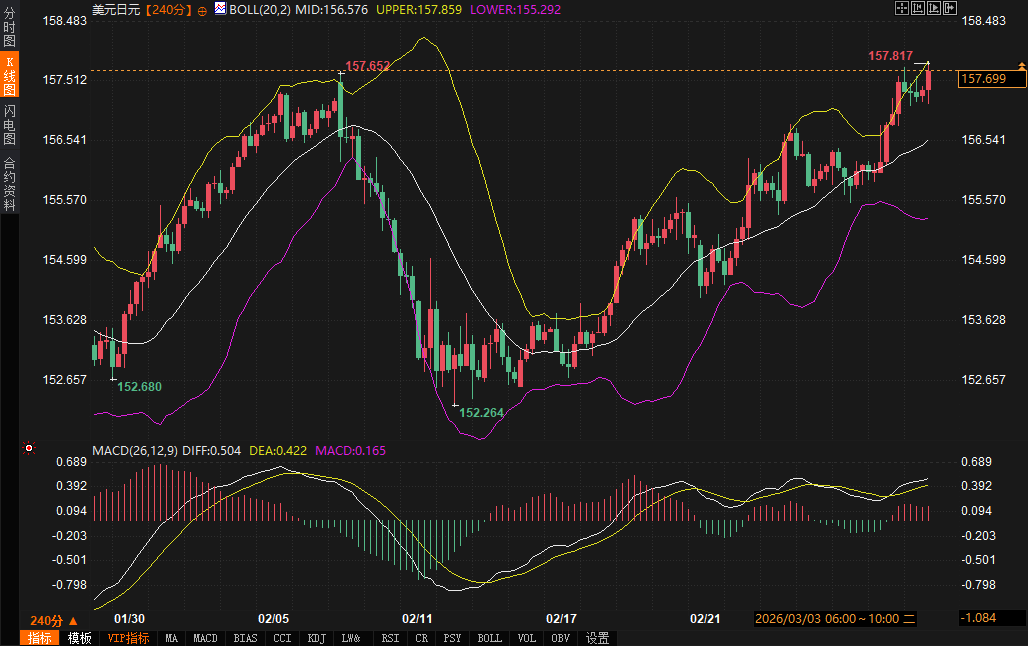
The USD/JPY 4-hour chart shows that the price started rising from around 152.680 at the end of January, reached 157.652 in early February, and then quickly pulled back, hitting a low of 152.264 before resuming its upward trend and currently returning to the previous high area. Overall, it exhibits a typical oscillating upward structure, with a clear bullish trend since February 21st. The price action has been steadily rising along the Bollinger Middle Band, with limited pullbacks and persistently dominant buying power.
With Bollinger Bands (20,2) parameters, the upper band is at 157.859, the middle band at 156.576, and the lower band at 155.292. The current price is closely following the upper band, indicating a strong expansionary trend in the short term. The middle band provides dynamic support, while the previous consolidation range of 155.5-155.7 serves as a reference for deeper retracements.
In the MACD (26,12,9) indicator, the DIFF value of 0.504 is above the DEA value of 0.422, and the MACD histogram value is 0.165 with the red bars continuing to diverge, indicating strong bullish momentum. However, the indicator is already at a relatively high level, and the possibility of a top divergence should be noted. The 30-day and 60-day logarithmic correlations show that the correlation coefficients for USD/JPY and EUR/JPY are both above 0.50, indicating that the two currency pairs are moving in sync, further confirming the overall weakness of the yen.
Technical and fundamental factors are converging here: rising Japanese government bond yields strengthen inflation expectations, weakening the yen's attractiveness, while the candlestick pattern, with a slight pullback followed by a steady recovery, confirms the bulls' control. Currently, the market is at a critical juncture, poised to break through previous highs, with the market rhythm shaped by a combination of fundamental events and technical indicators.
Potential impact of intervention risks
Despite both technical and fundamental factors pointing to further upside potential for the USD/JPY exchange rate, the Japanese authorities' stance on exchange rate fluctuations remains a significant constraint. Japan's Finance Minister stated on Tuesday that amid market volatility triggered by the Middle East conflict, the government is maintaining close contact with overseas financial officials and monitoring financial markets with a "very strong sense of urgency." This statement sends a clear signal that while the threshold for intervention remains high, monitoring has reached a high level of alert.
Historical experience suggests that if direct intervention occurs, the significant technical gap between the closing price of 147.45 on October 3rd and the opening price of 149.02 on October 6th could be filled. This gap is located far below the current price level, and its triggering would significantly impact bullish expectations. The market currently views the risk of intervention as a background factor rather than an immediate event, but such expectations may gradually intensify as the exchange rate approaches higher resistance levels.
The yen weakened alongside the euro, with the yen's dependence on energy imports amplifying the impact of the Middle East situation on both currencies. The presence of intervention risks makes the exchange rate's upward path "gradual but limited": fundamentals and technical factors support continued gains, but potential policy actions set an implicit ceiling on excessive appreciation.
Support and resistance range prediction
Referring to the USD/JPY contract, the short-term resistance zone is focused on 157.652 to 157.859. The former is the high point in February, and the latter corresponds to the upper Bollinger Band. The rationale is that the candlestick has tested 157.652 multiple times and experienced slight pullbacks, while the upper Bollinger Band serves as a dynamic trend boundary, and a breakout requires increased trading volume and further expansion of the MACD histogram. If it holds above 157.859, it opens up the possibility of testing 159.23 on January 23 and the 2026 high of 159.45.
The support range corresponds to 156.576 to 155.5-155.7. The former is the Bollinger Middle Band, providing dynamic support for trend continuation; the latter is the previous consolidation platform, forming a stronger buffer against pullbacks. The range logic stems from the controllable pullback range within an upward consolidation structure. The Bollinger Middle Band acts as the central axis, and maintaining the price above this range means the bulls remain in control.
Key points to watch during the session include: a breakout confirmation near 157.80; if accompanied by a bullish candlestick and a sustained close above this level, the resistance zone will shift upwards. Conversely, if a pullback tests the 156.50-156.60 range, it's necessary to observe the strength of buying support and whether the MACD histogram is narrowing. These ranges are derived based on current 4-hour chart parameters and historical highs and lows, and are for reference only regarding market structure, not for specific trading decisions.
Future Trend Outlook
Looking ahead, if the Middle East conflict continues to fuel inflation expectations and Japanese bond yields remain high, without a significant strengthening of intervention signals from the Japanese authorities, the USD/JPY pair is likely to continue its upward trend, gradually testing higher resistance levels. Conversely, if monitoring results translate into concrete action, or if inflationary pressures ease temporarily, the exchange rate may quickly retreat to near the Bollinger Middle Band and re-enter a range-bound consolidation phase.
Overall, the convergence of fundamental inflation concerns and technical bullish momentum remains dominant, but intervention risk, as a core variable, will determine the sustainability of the upward trend. The market needs to continuously monitor the results of the Japanese government bond auction, statements from the Ministry of Finance, and the latest developments in the Middle East to grasp the changing pace of the market.
Frequently Asked Questions
Question 1: What factors mainly drove the rise in Japanese government bond yields on Tuesday?
Answer: The core driver was the market's repricing of the ongoing Middle East conflict. Previously seen as a safe-haven event prompting purchases of government bonds, the continued hostility has shifted to inflation concerns, particularly pressure on energy-importing countries. The 10-year yield rose 6 basis points to 2.12%, reflecting this shift in both end-of-auction selling pressure and long-term selling pressure, coinciding with the strengthening of the USD/JPY.
Question 2: What strong signals are emerging from the technical aspects of the USD/JPY exchange rate?
Answer: The price is trading close to the upper Bollinger Band at 157.859, the MACD histogram continues to expand, and the DIFF line is above the DEA line. The price has steadily recovered from the low of 152.264 to the previous high of 157.652, with a small pullback and stable buying power. The 30-day and 60-day correlations show a synchronized movement with the EUR/JPY pair, indicating a clear overall bullish control.
Question 3: What is the practical significance of the Japanese Finance Minister's statement on exchange rates?
Answer: The statement emphasizes a “strong sense of urgency” in monitoring and maintaining contact with overseas entities, indicating that while intervention is not an immediate option, risks are already lurking in the background. If triggered, it could fill the technical gap between 147.45 and 149.02, setting an implicit upper limit on the current price level around 157.70, thus limiting excessive appreciation.
Question 4: What is the logical basis for predicting support and resistance zones?
Answer: Resistance is at 157.652-157.859, based on historical highs and the upper Bollinger Band; a breakout requires strong trading volume. Support is at 156.576-155.5-155.7, relying on the middle Bollinger Band and previous support levels; maintaining above these levels indicates the continuation of the trend. This logic stems from the superposition of dynamic boundaries and historical levels within an upward oscillating structure, and is intended for observation of the market structure only.
Question 5: How will the Middle East conflict continue to affect the yen's exchange rate?
Answer: The escalating conflict has drawn market attention to energy-dependent countries and central bank inflation responses, causing Japanese bond yields to rise and weakening the yen's attractiveness. The yen's simultaneous weakening in tandem with the euro further amplifies this effect, creating a short-term downside for the yen. However, if the situation eases or intervention occurs, the weakness may reverse in the short term.
- Risk Warning and Disclaimer
- The market involves risk, and trading may not be suitable for all investors. This article is for reference only and does not constitute personal investment advice, nor does it take into account certain users’ specific investment objectives, financial situation, or other needs. Any investment decisions made based on this information are at your own risk.