European natural gas prices surged 88% in two days, while US natural gas prices reached a resistance level.
2026-03-03 19:09:03
The situation in the Middle East is affecting global financial markets, most notably energy. While most people usually focus on crude oil prices, the recent surge in European natural gas prices has surprised many.
Seeing is believing. Below, we will use three market charts to examine the natural gas market in Europe and the United States, and analyze the technical aspects of US natural gas futures and the three main factors contributing to the price differences between US and European natural gas futures.
As shown in Figure 1, let's take a look at the candlestick chart to see how exaggerated the iconic European natural gas futures market is.
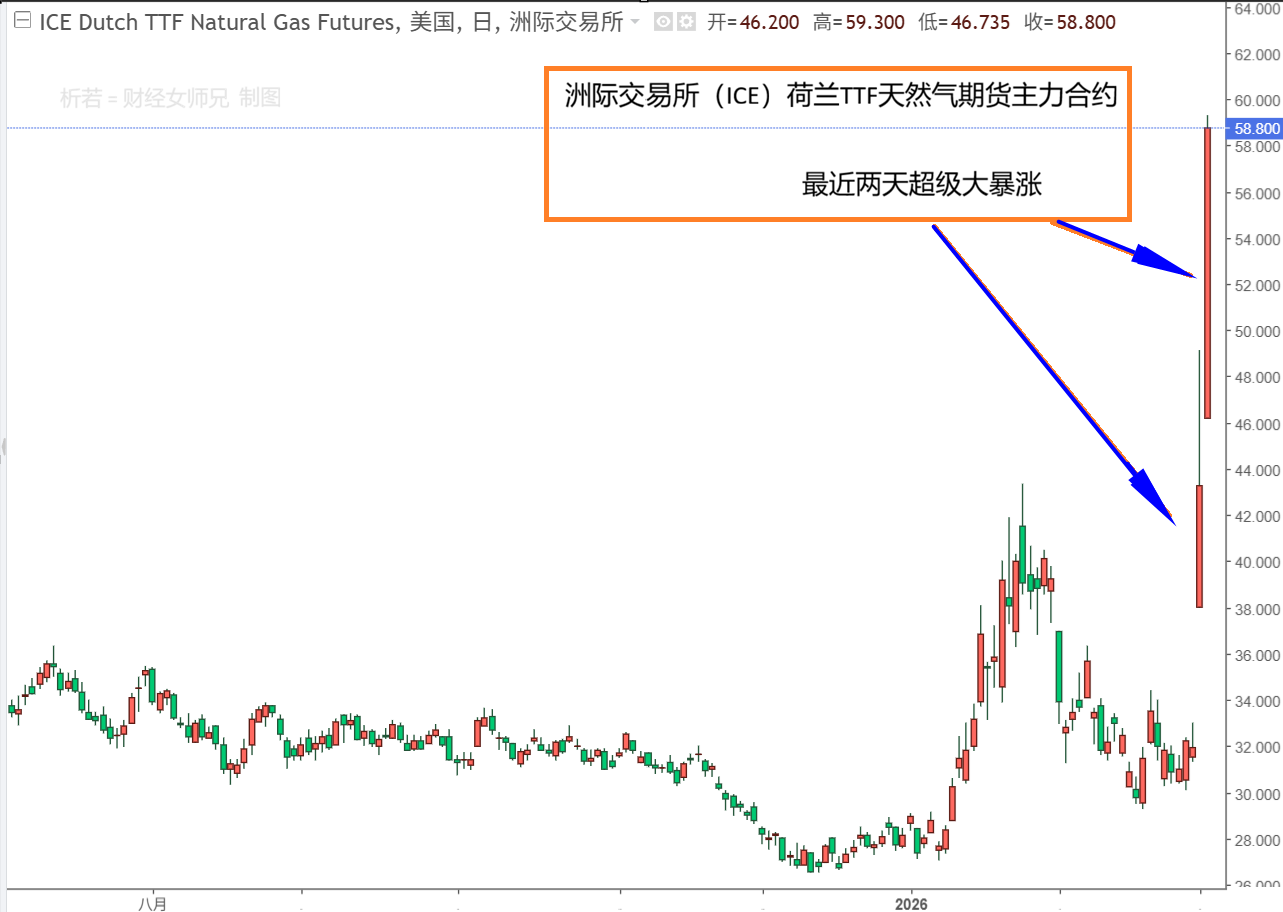
(Figure 1: Overview of the surge in European natural gas futures)
Market data shows that European TTF natural gas futures opened sharply higher on Monday, March 2nd, from €31.525/MWh at the close last Friday to €38.05, then surged to a high of €49.14 before closing at €43.3 yesterday. Today, March 3rd, during the European session, it further climbed to €59.3 and is currently fluctuating near its highest price.
In other words, comparing the European TTF natural gas futures with yesterday's closing data, the price surged by 55.88% on Monday, March 2nd, and also rose by 36.95% intraday on March 3rd. If we compare the current high of $59.3 with last Friday's closing price, it represents an 88.1% increase in two days.
However, compared to the peak price of €240/MWh reached in August 2022, the current European natural gas futures price still offers bulls plenty of room for imagination.
Having looked at European natural gas, let's take a look at American natural gas.
In contrast, U.S. natural gas futures appear to be a minor player.
As shown in Figure 2, the main U.S. natural gas futures contract only fluctuated by 7.11% on March 2nd, closing up just 4.31%. Today's gains have increased, with an intraday high of 6.9%. Currently, it is facing resistance from a key resistance line, as shown by the yellow line in the figure. This resistance level is formed by connecting multiple highs and lows since late August last year, turning support into resistance. We should pay attention to the subsequent market pullback and consolidation.
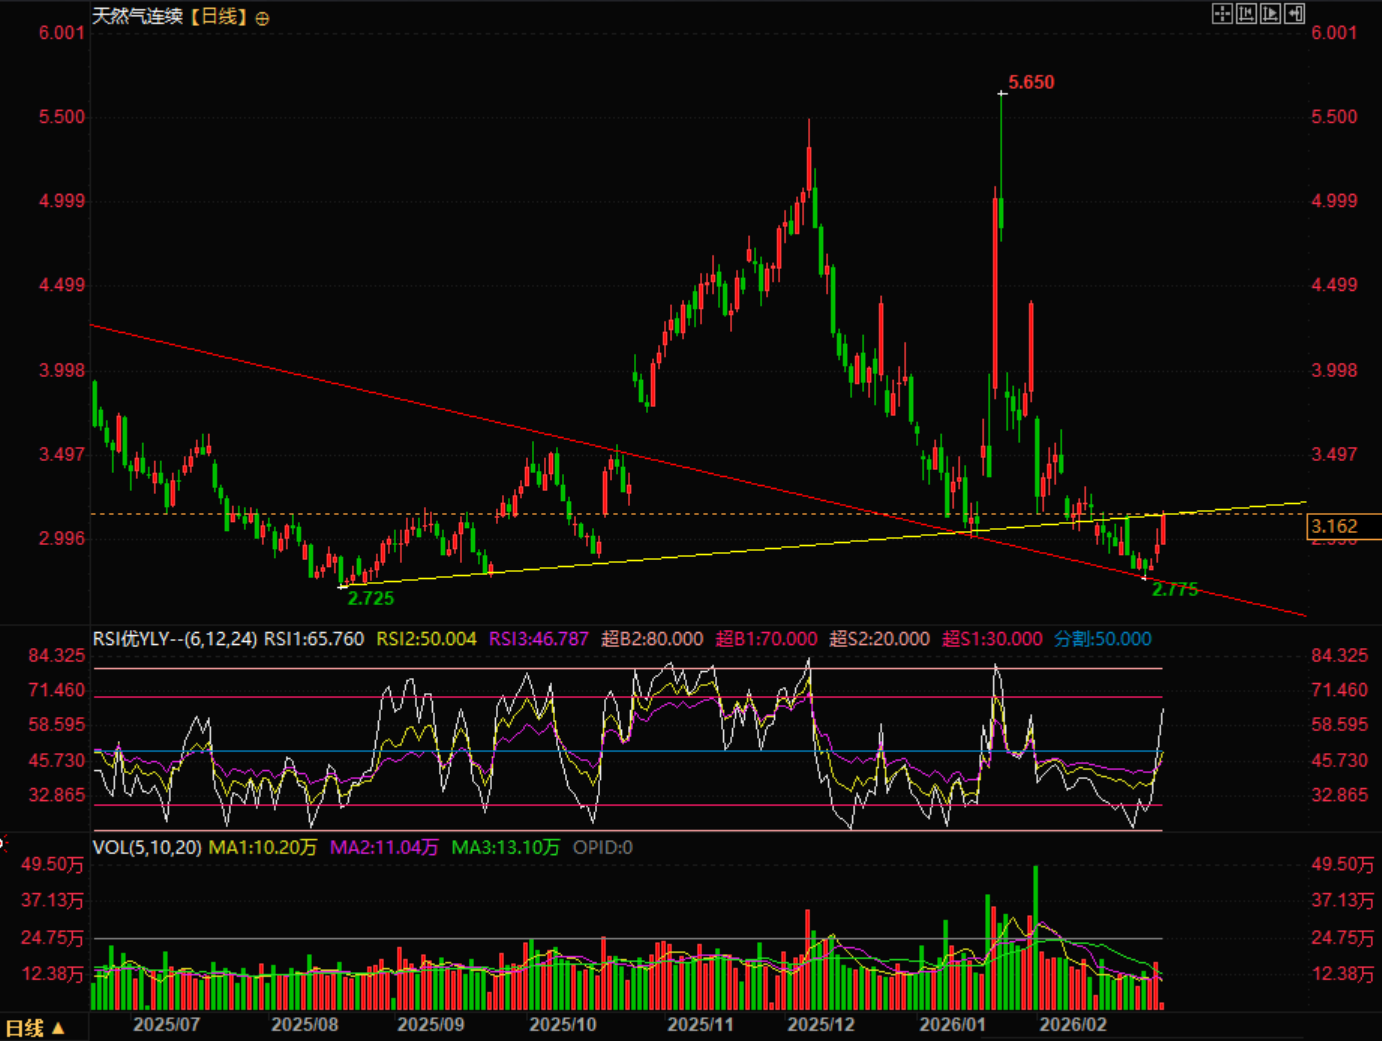
(Figure 2: Compared to Europe, the rise in US natural gas futures is negligible)
Overall, bullish sentiment still dominates, but a reasonable pullback after a sharp rise is still possible. Once resistance is reached, the main focus should be on observing how the market tests the resistance level.
As shown in Figure 3, all U.S. natural gas futures contracts for different expiration months show a gradual upward trend. This positive market and premium structure is a typical bull market signal. (Currently, the April futures contract is the most active contract).

(Figure 3: US natural gas futures contracts for each month)
Why do European and American natural gas markets react so differently to escalating geopolitical conflicts in the Middle East? There are three main reasons: fundamental differences in supply and demand structures, dependence levels, and economic fundamentals.
First, Europe has become the hardest hit area in this round of shocks, primarily due to its extreme vulnerability to supply disruptions. Escalating tensions in the Middle East, coupled with the shutdown of Qatar's LNG facilities, threaten to disrupt approximately 20% of global LNG supply. The obstruction of shipping through the Strait of Hormuz further cuts off this vital energy transport artery. Having lost access to pipeline gas from Russia, Europe is heavily reliant on spot LNG imports. Current inventories are at a low level compared to recent years, coinciding with the crucial summer restocking season. The supply disruption has directly triggered panic buying, with a massive influx of funds driving up prices. The European market's pricing of geopolitical risks has shifted from "concern" to "a real supply disruption crisis," naturally leading to soaring prices.
The calm and stable performance of US natural gas prices stems from self-sufficiency and a loose economic fundamentals. The US is the world's largest natural gas producer, with consistently high shale gas production and complete domestic supply independence, unaffected by LNG supply disruptions from the Middle East. Currently, US winter heating demand is nearing its end, rising temperatures are suppressing consumption, and inventories are close to the five-year average, resulting in a loose supply-demand balance. Even though European scrambles have boosted US LNG exports, its export facilities are operating at full capacity, limiting further increases and making it difficult to drive a significant rise in domestic prices; only a slight rebound reflects risk aversion.
From a market perspective, Europe is the global center for spot pricing of liquefied natural gas (LNG), and prices are determined by marginal supply, so even the slightest change can cause dramatic fluctuations.
The United States is a domestic market where supply and demand determine prices, which are primarily driven by production, inventory, and weather. Geopolitical shocks only have an indirect impact.
This pricing model, where "Europe looks at the global picture and the US looks at its own," destined the two to diverge in their trajectory during the crisis.
Looking ahead, US natural gas futures are unlikely to see significant one-sided price movements and will likely maintain a weak and volatile trend.
In the short term, if the conflict in the Middle East continues and the scramble for LNG in Europe intensifies, the demand for US LNG exports may increase slightly, leading to a moderate rebound in prices to the $3.0-$3.3 range. However, the upside potential is firmly suppressed by high production and weak demand.
If the conflict eases, supply risks subside, and the off-season for demand arrives in spring, prices will likely return to a downward trend, testing the support level of previous lows.
In summary, this round of gas price divergence accurately reflects the situation of "Europe lacking gas, while the United States has a surplus." The European market remains dominated by geopolitical risks, and volatility will continue to be high; while US natural gas is returning to fundamentals, with a focus on consolidation.
Because the surge in European natural gas prices has been so frenzied, US natural gas futures will also be dominated by bullish sentiment. However, fundamentally, for traders, Europe should focus on the progress of the conflict, while the US should focus on inventory and weather. It is crucial not to view both markets with a one-sided perspective.
This article is an original work by Xiruo and is copyrighted. It is for reference only and should not be used as a basis for transactions.
Seeing is believing. Below, we will use three market charts to examine the natural gas market in Europe and the United States, and analyze the technical aspects of US natural gas futures and the three main factors contributing to the price differences between US and European natural gas futures.
As shown in Figure 1, let's take a look at the candlestick chart to see how exaggerated the iconic European natural gas futures market is.
(Figure 1: Overview of the surge in European natural gas futures)
Market data shows that European TTF natural gas futures opened sharply higher on Monday, March 2nd, from €31.525/MWh at the close last Friday to €38.05, then surged to a high of €49.14 before closing at €43.3 yesterday. Today, March 3rd, during the European session, it further climbed to €59.3 and is currently fluctuating near its highest price.
In other words, comparing the European TTF natural gas futures with yesterday's closing data, the price surged by 55.88% on Monday, March 2nd, and also rose by 36.95% intraday on March 3rd. If we compare the current high of $59.3 with last Friday's closing price, it represents an 88.1% increase in two days.
However, compared to the peak price of €240/MWh reached in August 2022, the current European natural gas futures price still offers bulls plenty of room for imagination.
Having looked at European natural gas, let's take a look at American natural gas.
In contrast, U.S. natural gas futures appear to be a minor player.
As shown in Figure 2, the main U.S. natural gas futures contract only fluctuated by 7.11% on March 2nd, closing up just 4.31%. Today's gains have increased, with an intraday high of 6.9%. Currently, it is facing resistance from a key resistance line, as shown by the yellow line in the figure. This resistance level is formed by connecting multiple highs and lows since late August last year, turning support into resistance. We should pay attention to the subsequent market pullback and consolidation.
(Figure 2: Compared to Europe, the rise in US natural gas futures is negligible)
Overall, bullish sentiment still dominates, but a reasonable pullback after a sharp rise is still possible. Once resistance is reached, the main focus should be on observing how the market tests the resistance level.
As shown in Figure 3, all U.S. natural gas futures contracts for different expiration months show a gradual upward trend. This positive market and premium structure is a typical bull market signal. (Currently, the April futures contract is the most active contract).
(Figure 3: US natural gas futures contracts for each month)
Natural gas in Europe and America: the same substance, but different fates.
Why do European and American natural gas markets react so differently to escalating geopolitical conflicts in the Middle East? There are three main reasons: fundamental differences in supply and demand structures, dependence levels, and economic fundamentals.
First, Europe has become the hardest hit area in this round of shocks, primarily due to its extreme vulnerability to supply disruptions. Escalating tensions in the Middle East, coupled with the shutdown of Qatar's LNG facilities, threaten to disrupt approximately 20% of global LNG supply. The obstruction of shipping through the Strait of Hormuz further cuts off this vital energy transport artery. Having lost access to pipeline gas from Russia, Europe is heavily reliant on spot LNG imports. Current inventories are at a low level compared to recent years, coinciding with the crucial summer restocking season. The supply disruption has directly triggered panic buying, with a massive influx of funds driving up prices. The European market's pricing of geopolitical risks has shifted from "concern" to "a real supply disruption crisis," naturally leading to soaring prices.
The calm and stable performance of US natural gas prices stems from self-sufficiency and a loose economic fundamentals. The US is the world's largest natural gas producer, with consistently high shale gas production and complete domestic supply independence, unaffected by LNG supply disruptions from the Middle East. Currently, US winter heating demand is nearing its end, rising temperatures are suppressing consumption, and inventories are close to the five-year average, resulting in a loose supply-demand balance. Even though European scrambles have boosted US LNG exports, its export facilities are operating at full capacity, limiting further increases and making it difficult to drive a significant rise in domestic prices; only a slight rebound reflects risk aversion.
From a market perspective, Europe is the global center for spot pricing of liquefied natural gas (LNG), and prices are determined by marginal supply, so even the slightest change can cause dramatic fluctuations.
The United States is a domestic market where supply and demand determine prices, which are primarily driven by production, inventory, and weather. Geopolitical shocks only have an indirect impact.
This pricing model, where "Europe looks at the global picture and the US looks at its own," destined the two to diverge in their trajectory during the crisis.
Looking ahead, US natural gas futures are unlikely to see significant one-sided price movements and will likely maintain a weak and volatile trend.
In the short term, if the conflict in the Middle East continues and the scramble for LNG in Europe intensifies, the demand for US LNG exports may increase slightly, leading to a moderate rebound in prices to the $3.0-$3.3 range. However, the upside potential is firmly suppressed by high production and weak demand.
If the conflict eases, supply risks subside, and the off-season for demand arrives in spring, prices will likely return to a downward trend, testing the support level of previous lows.
In summary, this round of gas price divergence accurately reflects the situation of "Europe lacking gas, while the United States has a surplus." The European market remains dominated by geopolitical risks, and volatility will continue to be high; while US natural gas is returning to fundamentals, with a focus on consolidation.
Because the surge in European natural gas prices has been so frenzied, US natural gas futures will also be dominated by bullish sentiment. However, fundamentally, for traders, Europe should focus on the progress of the conflict, while the US should focus on inventory and weather. It is crucial not to view both markets with a one-sided perspective.
This article is an original work by Xiruo and is copyrighted. It is for reference only and should not be used as a basis for transactions.
- Risk Warning and Disclaimer
- The market involves risk, and trading may not be suitable for all investors. This article is for reference only and does not constitute personal investment advice, nor does it take into account certain users’ specific investment objectives, financial situation, or other needs. Any investment decisions made based on this information are at your own risk.