When war is no longer a "safe haven": US Treasury yields and the dollar soar, why is gold the only one suffering?
2026-03-03 20:35:30
Table of Contents
On Tuesday (March 3), during the European trading session, geopolitical tensions escalated sharply as the United States and Israel launched military strikes against Iranian targets, triggering significant volatility in global financial markets. However, unlike the typical "risk-averse" market reaction to past geopolitical crises, the reactions of various assets this time exhibited significant divergence and structural characteristics. The US dollar index continued its strong performance, breaking through the 99 mark and reaching a one-month high. The 10-year US Treasury yield rebounded rapidly in a V-shape after a brief dip, returning to above 4.0%. This divergence in asset price performance reveals that the core of the current market trading logic has shifted from simple geopolitical panic to a deeper pricing of the reassessment of inflation expectations and the structural impact of energy shocks.

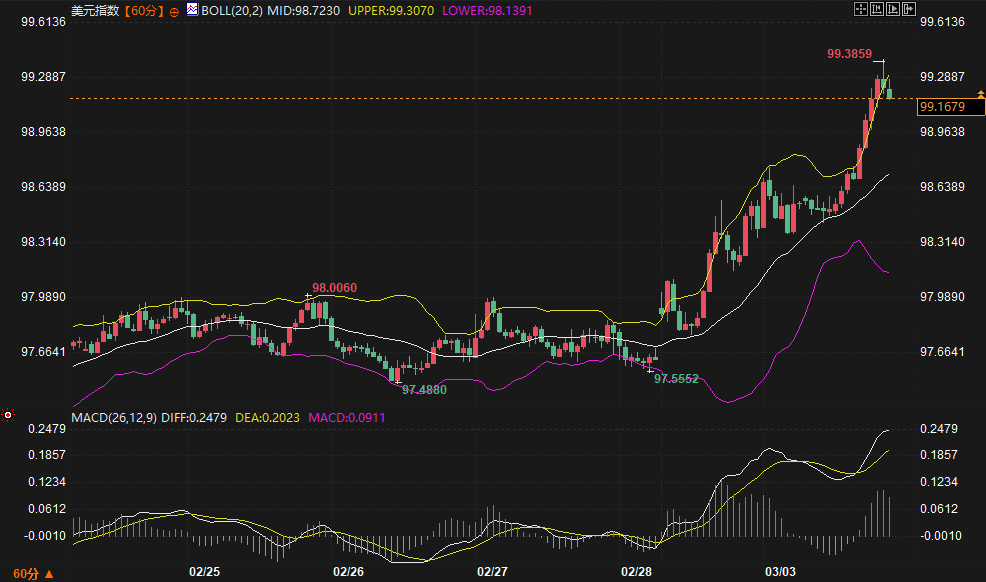
In traditional analytical frameworks, geopolitical conflicts often trigger a capital inflow into US Treasuries as a safe haven, pushing down yields and weakening the dollar or keeping it volatile. However, the market reaction this time was quite different. Technically, the 60-minute chart of the 10-year US Treasury yield shows a clear V-shaped reversal, with prices rebounding strongly from a low of 3.925%, breaking through the Bollinger Band's middle band and further approaching the upper band. The MACD indicator formed a golden cross and the histogram turned positive, confirming the return of short-term bullish momentum . A well-known institution commented that while the market initially experienced a brief rebound due to short covering, it was immediately met with sharp selling, and no sustained safe-haven buying was observed throughout the day. This indicates that market participants quickly shifted their attention from "safe haven" to the "risk" itself—namely, the potential for sustained inflationary pressures from the Middle East situation.
The core driver of rising US Treasury yields is the surge in energy prices. Saudi Aramco's consideration of alternative routes to bypass the Strait of Hormuz for crude oil exports has exacerbated market concerns about energy supply disruptions , pushing Brent crude prices even higher. For global economic growth, rising oil prices constitute a negative supply shock; however, for monetary policy, the resulting upside risk to inflation is forcing the market to reassess central bank actions. Reports from prominent institutions clearly point out that the market's reaction to the Middle East conflict is fundamentally different from the Russia-Ukraine situation, suggesting that this conflict may be shorter in duration, but its direct threat to energy infrastructure makes its inflationary consequences more immediate.
This concern about inflation has directly impacted the foreign exchange market. The strength of the US dollar index is not due to the traditional "repatriation of safe-haven funds," but rather a reflection of a "relative economic shock." Since the US is already a net energy exporter, the demand-side impact of rising oil prices on its domestic economy is relatively small; instead, it may reinforce expectations that the Federal Reserve will maintain high interest rates by pushing up inflation. In contrast, currencies of major energy-importing regions such as the Eurozone and Japan have weakened significantly due to huge energy import bills and concerns about economic growth prospects. As some strategists have noted, this is not a proactive pursuit of the dollar, but rather a "passive push" of the dollar by other currencies struggling with energy vulnerabilities. Therefore, the rebound in US Treasury yields and the strengthening of the dollar are closely linked in the current environment through the logic of "inflation-interest rate differential."
The gold market is under pressure, and the bond market transmission mechanism is weakening its traditional safe-haven attributes.
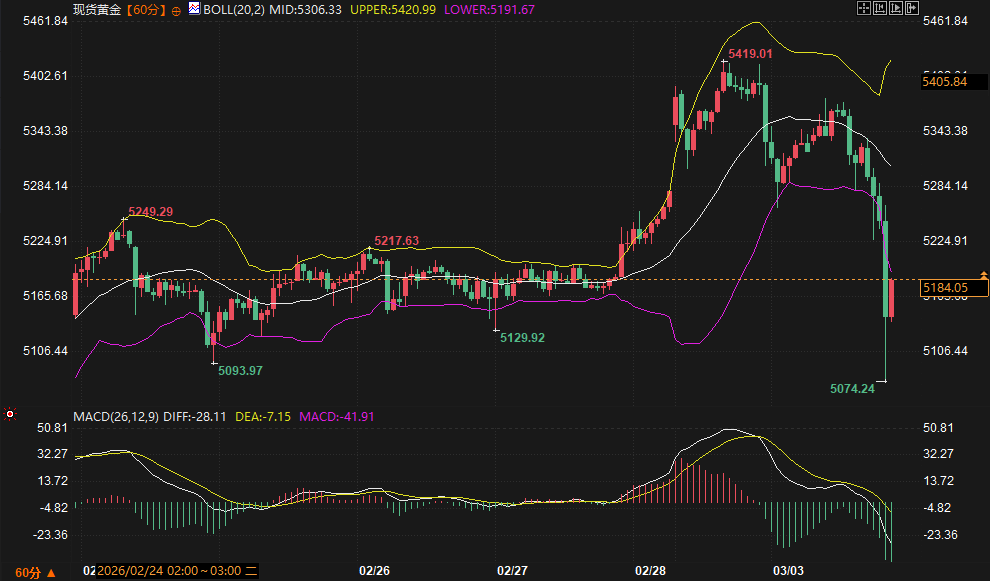
Gold's performance during this geopolitical crisis has surprised many investors. Often considered the ultimate safe-haven asset, gold failed to surge amid the Middle East conflict, instead experiencing a significant decline on Tuesday, briefly dipping to around $5185 per ounce. Looking at the 60-minute candlestick chart, gold prices have retreated from a high of $5249, breaking through the Bollinger Band's middle line and previous technical support levels, and are currently struggling near the lower Bollinger Band. The MACD indicator shows a bearish alignment, indicating heavy short-term selling pressure .
The key to gold's recent weakness lies in the renewed dominance of its negative correlation with both real and nominal interest rates. Market concerns about inflation have pushed up nominal yields on US Treasury bonds, directly increasing the opportunity cost of holding gold, a non-interest-bearing asset. More importantly, the shift in market expectations regarding the Federal Reserve's monetary policy constitutes a substantial negative factor. Analysis from prominent institutions indicates that the market now prioritizes inflation risks over geopolitical conflicts themselves, thus reducing bets on the magnitude of rate cuts this year . The federal funds rate futures market shows that the first fully priced-in rate cut has been postponed from July to September.
From this perspective, the bond market, through "interest rate expectations," has transmitted a significant negative effect to the gold market. While geopolitical risks should theoretically stimulate safe-haven demand for gold, when these risks simultaneously trigger market concerns about runaway global inflation and tightening monetary policies by major central banks, the suppressive force of interest rates outweighs the boost to safe-haven demand. Gold currently plays more of a "commodity" role reflecting inflation expectations than a purely "safe-haven" asset. Only when market concerns about prolonged conflict leading to "stagflation" outweigh the fear of interest rate hikes will gold's safe-haven appeal likely reappear.
Technical Indicators and Key Range Forecasts
Based on current market dynamics and technical charts, the price range and key points to watch for major assets over the next 2-3 trading days are as follows:
US Dollar Index (DXY)
Reference Contract : Spot US Dollar Index
Support range : 98.50 - 98.80 . This range represents a previous area of high trading volume and is near the middle Bollinger Band. If the US dollar experiences a technical pullback, this area will provide initial support.
Resistance range : 99.60 - 100.00 . 99.60 is the recent high and constitutes short-term resistance. A successful break above this level would target the psychological threshold of 100.
Key focus during the trading session : Pay close attention to oil price movements during the European session and the early New York session. A significant drop in oil prices could ease pressure on the euro and yen, potentially triggering a technical correction in the dollar. Furthermore, public statements from Federal Reserve officials, particularly regarding inflation and interest rate prospects, could cause market volatility.
Spot gold (XAUUSD)
Reference Contract : Spot Gold
Support range : $5150 - $5180 . This range represents the previous pullback lows. A break below this support could see gold prices move further down to find the next technical support level on the 60-minute chart.
Resistance zone : $5250 - $5280 . The previous high of $5249 and the Bollinger Band middle line at $5306 form a short-term resistance zone. Gold prices need to regain a foothold above $5250 to alleviate short-term bearish sentiment.
Key focus during trading : The core focus is on the trend of the 10-year US Treasury yield. If the yield continues to rise and stabilizes above 4.10%, gold prices will face further pressure. Conversely, if the yield falls from its high, it may provide a brief respite for gold prices.
10-year US Treasury yield (US10Y)
Reference Contract : 10-Year US Treasury Yield
Support range : 4.00% - 4.03% . The previous rebound breakout point and the Bollinger Band middle line are key indicators of whether the short-term uptrend can be sustained.
Resistance zone : 4.12% - 4.15% . If geopolitical tensions continue to push up oil prices, or if subsequent inflation data raises concerns, yields are likely to test this resistance zone.
Key focus during trading : Latest developments in the geopolitical situation, particularly regarding shipping in the Strait of Hormuz and statements from Saudi Arabia and other domestic energy producers. Any news that could potentially extend energy supply disruptions will likely drive yields further upward.

Outlook for the next 2-3 trading days
Looking ahead to the next 2-3 trading days, the core trading logic will revolve around the duration of the geopolitical conflict and the extent to which energy prices transmit to inflation. If the conflict shows no signs of a swift resolution, or if the threat to energy infrastructure persists, the current market structure is expected to continue: US Treasury yields will remain high, the US dollar will remain strong due to interest rate differentials and relative economic advantages, and spot gold will continue to face pressure from interest rates , with its rebound limited by significant resistance levels. Conversely, if there are any signs of easing geopolitical tensions, or if major economies take joint measures to stabilize the energy market, it could trigger a rapid pullback in US Treasury yields. At that point, the dollar's rally would pause, and gold could see a short-covering rebound. Until a clear technical breakout or reversal signal appears, the market will likely maintain its current pricing model driven by inflation expectations.
Frequently Asked Questions
Q: Why did the US dollar rise sharply during this Middle East conflict instead of falling due to risk aversion as it has in previous crises?
A: The core driver of this dollar's rise is not traditional "safe-haven buying," but rather a structural difference in the impact of energy prices . The US is now a net energy exporter, so rising oil prices have a relatively small impact on its economy and may even strengthen expectations of a Fed rate hike by pushing up inflation, thus supporting the dollar. In contrast, major economies like the Eurozone and Japan are major energy importers, and soaring oil prices directly hit their economies, leading to a significant depreciation of the euro and yen. Therefore, the dollar's strength is more a reflection of the differences in relative economic fundamentals and monetary policy expectations ; it is being "passively" pushed up.Q: Isn't gold a safe-haven asset? Why did the price of gold fall when war broke out?
A: This precisely illustrates the complex and divergent trading logic in the current market. While gold does possess safe-haven attributes, its price is also heavily influenced by real interest rates (nominal interest rates minus inflation expectations). The current geopolitical conflict has triggered market concerns that rising oil prices will lead to increased inflation, potentially causing major central banks (especially the Federal Reserve) to postpone interest rate cuts or even reconsider rate hikes. This has resulted in a rapid rise in nominal yields on US Treasury bonds, increasing the opportunity cost of holding gold, a non-interest-bearing asset. At the current stage, the downward pressure from interest rates outweighs the boost from safe-haven demand , thus putting downward pressure on gold prices.Q: Rising US Treasury yields usually indicate a healthy economy, but this time it's due to geopolitical conflict. How do you understand this?
A: The recent rise in US Treasury yields is not entirely due to strong economic fundamentals, but rather reflects the market's repricing of the "inflation premium." The conflict threatens the Strait of Hormuz, a key energy route, causing oil prices to surge. Market concerns that this will further fuel already high inflation have led to demands for higher yields to compensate for the risk of future inflation increases. This is a typical example of yield increases triggered by a supply shock , which is not favorable for risk assets and economic growth expectations.Q: The article mentions a "structural shift in the logic of risk aversion." What does this specifically refer to?
A: The traditional hedging logic is "crisis outbreak → capital flight from risk → buying US Treasuries and gold → pushing down US Treasury yields and pushing up gold prices." The structural shift this time is that the market quickly focused on the potential long-term inflationary consequences of the crisis from its early stages. Therefore, the capital flow logic has become "crisis outbreak → concerns about energy inflation → selling (energy-dependent countries') currencies → buying (energy-independent countries') currencies → pushing up their interest rates to cope with inflation → simultaneously suppressing non-interest-bearing assets like gold." This is a more complex transmission chain based on inflation divergence and monetary policy expectations .Q: In the coming days, what are the most crucial indicators or events to watch to determine market trends?
A: The primary focus is on the geopolitical situation itself , especially the resumption of shipping in the Strait of Hormuz, statements from oil-producing countries like Saudi Arabia, and whether the conflict will escalate. Secondly, the sustainability of oil prices needs close monitoring; if they can stabilize below $80, market tensions may ease. Thirdly, pay attention to speeches by Federal Reserve officials; any hawkish statements regarding inflation risks could exacerbate market volatility. Finally, the upcoming US inflation data this week will be crucial in confirming market concerns; if the data exceeds expectations, the current upward pressure on US Treasury yields and gold will be further strengthened.
- Risk Warning and Disclaimer
- The market involves risk, and trading may not be suitable for all investors. This article is for reference only and does not constitute personal investment advice, nor does it take into account certain users’ specific investment objectives, financial situation, or other needs. Any investment decisions made based on this information are at your own risk.