Energy strangulation + safe-haven siphon: The battle for the key resistance level of 99.50 on the US dollar index
2026-03-04 19:42:13
In early March 2026, the narrative logic of global financial markets was completely restructured due to the sudden loss of control over the situation in the Middle East. With the Strait of Hormuz effectively paralyzed, this vital chokepoint for global oil trade is facing its most severe challenge since the "tanker wars" of the 1980s. Latest shipping data shows that due to widespread cancellations of insurance by marine insurers after March 1st, the daily tanker traffic, which was originally around 60 vessels, has plummeted to single digits. The successive attacks on core refineries and liquefied natural gas (LNG) export terminals in Saudi Arabia, Qatar, and Iran have not only directly reduced spot supply but also severely damaged global energy security expectations. Brent crude oil prices surged to $84.07 per barrel during Asian trading hours on March 4th, and natural gas prices rose by over 6% in a single day. This price premium, directly driven by the supply side, is triggering severe "double-dip inflation" fears globally.
Macroeconomic logic reshaped: The US dollar becomes the "ultimate safe haven".
Amidst the current extreme geopolitical turmoil, the US dollar has not only regained its traditional safe-haven asset status but also benefited from the inherent resilience of the United States as the world's largest energy producer. A briefing released by Goldman Sachs on March 4th pointed out that the foreign exchange market is currently experiencing a "liquidity siphon"—European and East Asian economies are highly dependent on Middle Eastern energy imports, and their trade balances are deteriorating sharply as energy prices soar. This fundamental asymmetry has led to a record-breaking outflow of global funds from non-US assets. The euro/dollar is currently hovering near the key support level of 1.16, while the yen has completely lost its traditional safe-haven function due to imported inflationary pressures caused by rising energy costs. The market generally expects that as long as the Middle East conflict does not subside, the previous interest rate cuts by major central banks worldwide will be forced to be postponed, and the possibility of the Federal Reserve adopting a hawkish stance in the second quarter of 2026 cannot be ruled out.
Market ripple effects: Global stock markets suffer "bleeding" and dollar short squeeze
The runaway rise in energy prices has dealt a fatal blow to global equity assets. Affected by soaring electricity costs and concerns about semiconductor supply chain disruptions, the South Korean KOSPI index recorded a staggering drop of approximately 12% on March 4th, while the Nikkei and German DAX indices also fell sharply. This panic further evolved into a brutal short squeeze on dollar shorts in the currency market. According to OANDA's trader positioning report, the market accumulated a large number of net short dollar positions in early 2026, and when the dollar index (DXY) broke through key psychological levels, the passive buying resulting from forced short covering further boosted the exchange rate. Morgan Stanley warned that this self-fulfilling process of "price-driven sentiment" could push the dollar into irrationally overbought territory in the short term.
Technical Analysis: The Decisive Battle at the 99.50 Resistance Zone
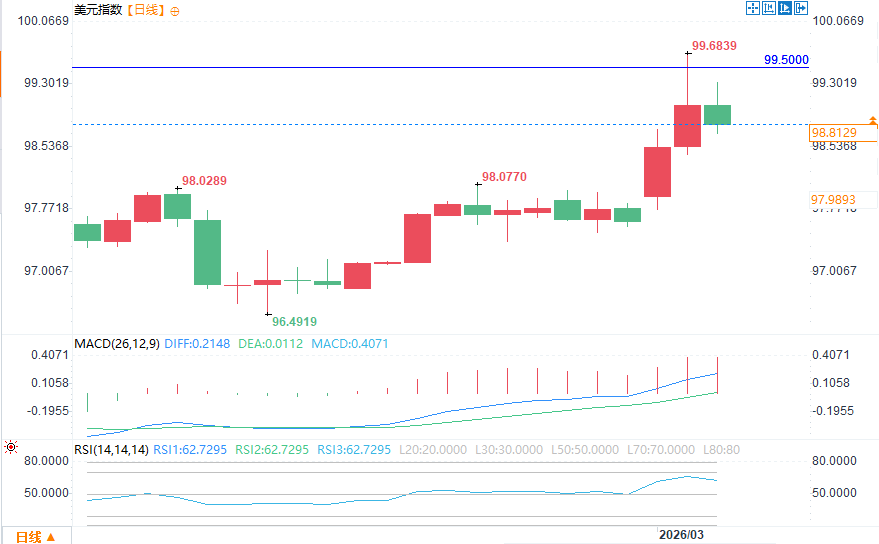
(US Dollar Index Daily Chart Source: FX678)
The US dollar index is currently standing at a "watershed" point in its long-term upward channel since 2008. The monthly chart shows that the dollar index is currently within a core resistance zone formed by connecting multiple highs and lows since the beginning of 2023, with the 99.50 level becoming the core focus of the current battle between bulls and bears.
Bullish breakout scenario
The price is currently testing the key level of 99.50 repeatedly. If the daily and weekly closing prices can effectively hold above this level and subsequently break through the strong resistance level of 100.40, it would mean that the sideways consolidation range of the past three years has been completely broken. In this scenario, the upside potential of the US dollar index will open up rapidly, with the next target pointing to the 102 level, and possibly even reaching the 105 range.
Bearish pullback scenario
Despite strong fundamental support, the RSI (Relative Strength Index) and Stochastic Oscillator are near extreme overbought territory. If the US dollar index fails to break through 99.50 effectively in the short term, profit-taking may occur, and the dollar index may retrace to the 98.00 support level, or even return to the large range of 96.50. Once the key support of 96.50 is broken, the downtrend will extend further to the 92 range near the 2021 lows, or even the 89 range.
Summary and Outlook: Focusing on the Insurance Window Period on March 5th
With the window of opportunity for marine insurance lapses approaching, the next 24 to 48 hours (around March 5th) will be crucial in determining whether the US dollar index can achieve a significant breakthrough. Investors need to closely monitor two developments: first, whether Saudi Aramco facilities suffer further damage; and second, whether the White House will use the Strategic Petroleum Reserve (SPR) to quell market panic. For forex traders, any bottom-fishing attempt against non-US dollar currencies before the energy situation becomes clearer is extremely risky. The current strength of the US dollar is not only a reflection of interest rate differentials but also an inevitable result of global capital repricing asset security in an extreme geopolitical environment.
Macroeconomic logic reshaped: The US dollar becomes the "ultimate safe haven".
Amidst the current extreme geopolitical turmoil, the US dollar has not only regained its traditional safe-haven asset status but also benefited from the inherent resilience of the United States as the world's largest energy producer. A briefing released by Goldman Sachs on March 4th pointed out that the foreign exchange market is currently experiencing a "liquidity siphon"—European and East Asian economies are highly dependent on Middle Eastern energy imports, and their trade balances are deteriorating sharply as energy prices soar. This fundamental asymmetry has led to a record-breaking outflow of global funds from non-US assets. The euro/dollar is currently hovering near the key support level of 1.16, while the yen has completely lost its traditional safe-haven function due to imported inflationary pressures caused by rising energy costs. The market generally expects that as long as the Middle East conflict does not subside, the previous interest rate cuts by major central banks worldwide will be forced to be postponed, and the possibility of the Federal Reserve adopting a hawkish stance in the second quarter of 2026 cannot be ruled out.
Market ripple effects: Global stock markets suffer "bleeding" and dollar short squeeze
The runaway rise in energy prices has dealt a fatal blow to global equity assets. Affected by soaring electricity costs and concerns about semiconductor supply chain disruptions, the South Korean KOSPI index recorded a staggering drop of approximately 12% on March 4th, while the Nikkei and German DAX indices also fell sharply. This panic further evolved into a brutal short squeeze on dollar shorts in the currency market. According to OANDA's trader positioning report, the market accumulated a large number of net short dollar positions in early 2026, and when the dollar index (DXY) broke through key psychological levels, the passive buying resulting from forced short covering further boosted the exchange rate. Morgan Stanley warned that this self-fulfilling process of "price-driven sentiment" could push the dollar into irrationally overbought territory in the short term.
Technical Analysis: The Decisive Battle at the 99.50 Resistance Zone
(US Dollar Index Daily Chart Source: FX678)
The US dollar index is currently standing at a "watershed" point in its long-term upward channel since 2008. The monthly chart shows that the dollar index is currently within a core resistance zone formed by connecting multiple highs and lows since the beginning of 2023, with the 99.50 level becoming the core focus of the current battle between bulls and bears.
Bullish breakout scenario
The price is currently testing the key level of 99.50 repeatedly. If the daily and weekly closing prices can effectively hold above this level and subsequently break through the strong resistance level of 100.40, it would mean that the sideways consolidation range of the past three years has been completely broken. In this scenario, the upside potential of the US dollar index will open up rapidly, with the next target pointing to the 102 level, and possibly even reaching the 105 range.
Bearish pullback scenario
Despite strong fundamental support, the RSI (Relative Strength Index) and Stochastic Oscillator are near extreme overbought territory. If the US dollar index fails to break through 99.50 effectively in the short term, profit-taking may occur, and the dollar index may retrace to the 98.00 support level, or even return to the large range of 96.50. Once the key support of 96.50 is broken, the downtrend will extend further to the 92 range near the 2021 lows, or even the 89 range.
Summary and Outlook: Focusing on the Insurance Window Period on March 5th
With the window of opportunity for marine insurance lapses approaching, the next 24 to 48 hours (around March 5th) will be crucial in determining whether the US dollar index can achieve a significant breakthrough. Investors need to closely monitor two developments: first, whether Saudi Aramco facilities suffer further damage; and second, whether the White House will use the Strategic Petroleum Reserve (SPR) to quell market panic. For forex traders, any bottom-fishing attempt against non-US dollar currencies before the energy situation becomes clearer is extremely risky. The current strength of the US dollar is not only a reflection of interest rate differentials but also an inevitable result of global capital repricing asset security in an extreme geopolitical environment.
- Risk Warning and Disclaimer
- The market involves risk, and trading may not be suitable for all investors. This article is for reference only and does not constitute personal investment advice, nor does it take into account certain users’ specific investment objectives, financial situation, or other needs. Any investment decisions made based on this information are at your own risk.