Will gold escape its current predicament on Friday? Will this be a case of buying on dips?
2026-03-04 19:45:12
On Wednesday, March 4th, spot gold traded around $5190 per ounce during the European session. This price level represents a pullback from the rapid rise triggered by geopolitical tensions. Currently, the price is around $5200, indicating that the market is digesting previous positive news and seeking a new equilibrium. This recent pullback, exceeding 10%, highlights the dominant role of short-term liquidity.
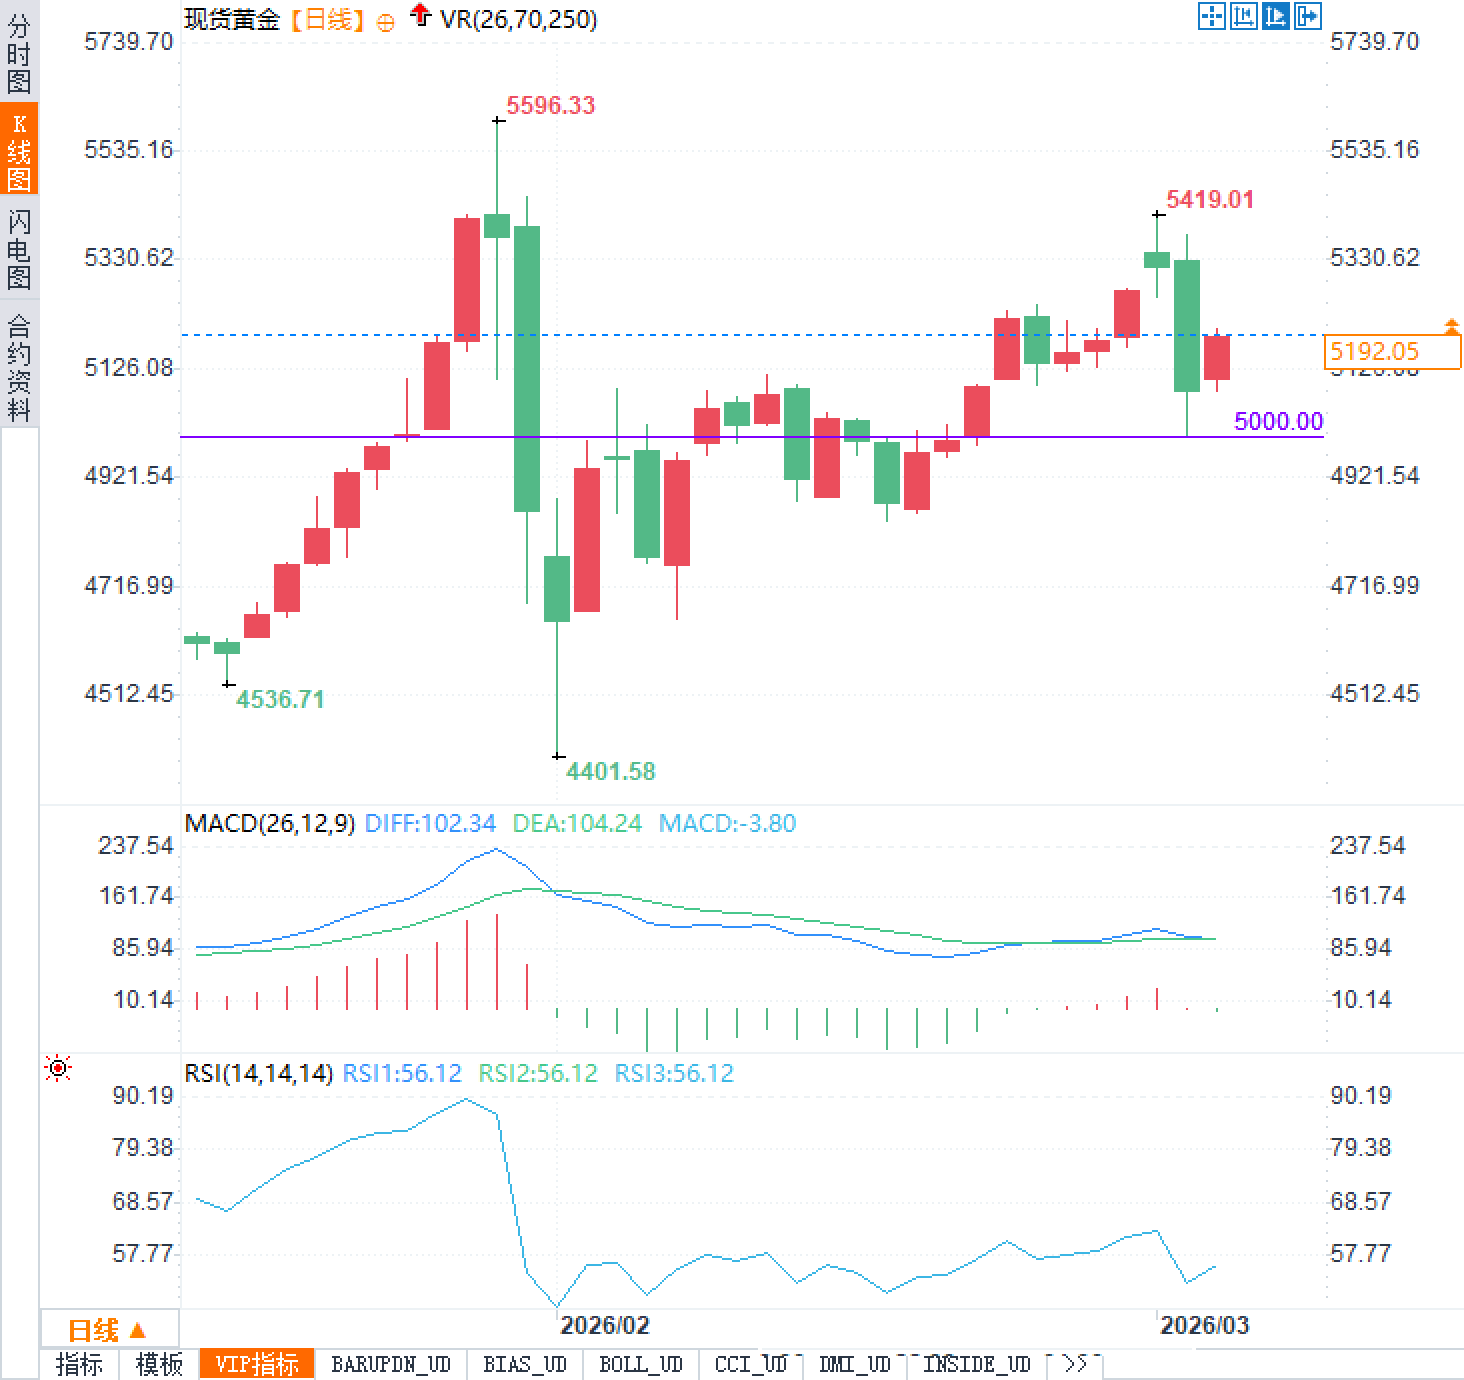
Key recent price levels for spot gold: High: $5419.01; Current price: $5192; Low: $5000
This price movement reflects a rapid shift in market sentiment, moving from initial geopolitical panic to a more rational assessment of liquidity management and economic data. Investors should note that prices have broken below several short-term moving averages, and the short-term direction still needs further confirmation.
In a highly risk-averse environment, gold failed to fulfill its traditional safe-haven role, instead experiencing pressure alongside the stock market. This is not an anomaly. When financial conditions tighten, investors and traders often face margin calls, forcing them to sell more liquid assets, including gold, to meet the requirements, leading to a synchronized price decline. This deleveraging process explains the recent pullback in gold prices, because in the early stages of a crisis, the market prioritizes cash positions over asset class differentiation, with safe-haven attributes temporarily giving way to liquidity needs.
As the peak of the panic subsided, gold prices began to gradually recover some lost ground. However, geopolitical factors continue to influence the energy market, pushing up oil prices and consequently raising global inflation expectations. As long as these tensions persist, this backdrop will provide significant support for gold prices. Rising energy costs are transmitted to overall price levels through production and transportation, weakening the real purchasing power of currencies and thus increasing gold's attractiveness as a store of value. This transmission mechanism has been repeatedly validated in similar market environments in the past, and in the long run, it helps gold overcome short-term adjustment pressures.
Geopolitical events are driving up energy costs, directly impacting inflation expectations. Gold, a traditional hedge against inflation, is therefore becoming more attractive. From a technical perspective, the Relative Strength Index (RSI) is at 56.12, in the neutral range, neither overbought nor oversold, indicating a temporary balance between bullish and bearish forces. The Moving Average Convergence Divergence (MACD) indicator shows a DIFF of 102.34, a DEA of 104.24, and a MACD value of -3.80, presenting a slightly bearish signal and suggesting slightly insufficient short-term momentum, but no clear reversal trend has yet formed.
However, the market needs to be wary of downside risks. If geopolitical tensions show signs of easing, the trading focus will quickly shift to macroeconomic data. Friday's non-farm payroll report will be key. Strong employment data could be a double whammy for gold, leading to a new round of selling pressure. This is because strong employment data usually reinforces market expectations of high interest rates, reducing the likelihood of rate cuts and thus suppressing precious metal prices. Conversely, weak data or escalating geopolitical risks could allow gold to regain its upward momentum.
In summary, the gold market is currently under the combined influence of geopolitical and economic data. Investors are focusing on developments and policy signals from the Federal Reserve. At current levels, gold still possesses some defensive characteristics, but potential volatility should be anticipated. In the long term, persistent inflationary pressures and uncertainty are likely to continue supporting the precious metals sector. Overall, analysts believe that gold faces a short-term correction, but the medium- to long-term outlook remains positive. As long as inflation expectations do not decline, the price level is expected to gradually rise.
Key recent price levels for spot gold: High: $5419.01; Current price: $5192; Low: $5000
This price movement reflects a rapid shift in market sentiment, moving from initial geopolitical panic to a more rational assessment of liquidity management and economic data. Investors should note that prices have broken below several short-term moving averages, and the short-term direction still needs further confirmation.
The unique behavioral logic of gold during periods of risk aversion
In a highly risk-averse environment, gold failed to fulfill its traditional safe-haven role, instead experiencing pressure alongside the stock market. This is not an anomaly. When financial conditions tighten, investors and traders often face margin calls, forcing them to sell more liquid assets, including gold, to meet the requirements, leading to a synchronized price decline. This deleveraging process explains the recent pullback in gold prices, because in the early stages of a crisis, the market prioritizes cash positions over asset class differentiation, with safe-haven attributes temporarily giving way to liquidity needs.
As the peak of the panic subsided, gold prices began to gradually recover some lost ground. However, geopolitical factors continue to influence the energy market, pushing up oil prices and consequently raising global inflation expectations. As long as these tensions persist, this backdrop will provide significant support for gold prices. Rising energy costs are transmitted to overall price levels through production and transportation, weakening the real purchasing power of currencies and thus increasing gold's attractiveness as a store of value. This transmission mechanism has been repeatedly validated in similar market environments in the past, and in the long run, it helps gold overcome short-term adjustment pressures.
Inflation expectations provide support, while data risks coexist.
Geopolitical events are driving up energy costs, directly impacting inflation expectations. Gold, a traditional hedge against inflation, is therefore becoming more attractive. From a technical perspective, the Relative Strength Index (RSI) is at 56.12, in the neutral range, neither overbought nor oversold, indicating a temporary balance between bullish and bearish forces. The Moving Average Convergence Divergence (MACD) indicator shows a DIFF of 102.34, a DEA of 104.24, and a MACD value of -3.80, presenting a slightly bearish signal and suggesting slightly insufficient short-term momentum, but no clear reversal trend has yet formed.
However, the market needs to be wary of downside risks. If geopolitical tensions show signs of easing, the trading focus will quickly shift to macroeconomic data. Friday's non-farm payroll report will be key. Strong employment data could be a double whammy for gold, leading to a new round of selling pressure. This is because strong employment data usually reinforces market expectations of high interest rates, reducing the likelihood of rate cuts and thus suppressing precious metal prices. Conversely, weak data or escalating geopolitical risks could allow gold to regain its upward momentum.
Market Outlook
In summary, the gold market is currently under the combined influence of geopolitical and economic data. Investors are focusing on developments and policy signals from the Federal Reserve. At current levels, gold still possesses some defensive characteristics, but potential volatility should be anticipated. In the long term, persistent inflationary pressures and uncertainty are likely to continue supporting the precious metals sector. Overall, analysts believe that gold faces a short-term correction, but the medium- to long-term outlook remains positive. As long as inflation expectations do not decline, the price level is expected to gradually rise.
Question 1: **Why has spot gold failed to fulfill its traditional safe-haven role in a risk-averse environment?**
A: When financial conditions tighten sharply, investors are forced to sell liquid assets such as gold to meet margin requirements, causing them to fall in tandem with risky assets. This deleveraging effect temporarily suppresses the safe-haven attribute, only gradually recovering after the peak of panic has passed.
Question 2: **Where does the support for gold prices come from in terms of geopolitical tensions?**
A: Tensions are pushing up energy prices and raising inflation expectations, increasing gold's appeal as an inflation hedge. This fundamental support will persist as long as the conflict continues; conversely, easing tensions will shift market focus to strong economic data, triggering selling pressure.
Question 3: **Why might the upcoming non-farm payroll report be a double blow to spot gold?**
A: If geopolitical risks ease simultaneously and employment data is strong, it will simultaneously eliminate safe-haven demand and reinforce expectations of high interest rates, leading to accelerated selling pressure on gold. The current slightly negative MACD and neutral RSI levels have already hinted at this potential risk.
- Risk Warning and Disclaimer
- The market involves risk, and trading may not be suitable for all investors. This article is for reference only and does not constitute personal investment advice, nor does it take into account certain users’ specific investment objectives, financial situation, or other needs. Any investment decisions made based on this information are at your own risk.