The Non-Farm Payrolls Cluster Mystery: A Shocking Unexpected Turn of Events Hidden in the 59,000-Strong Consensus?
2026-03-06 17:52:17
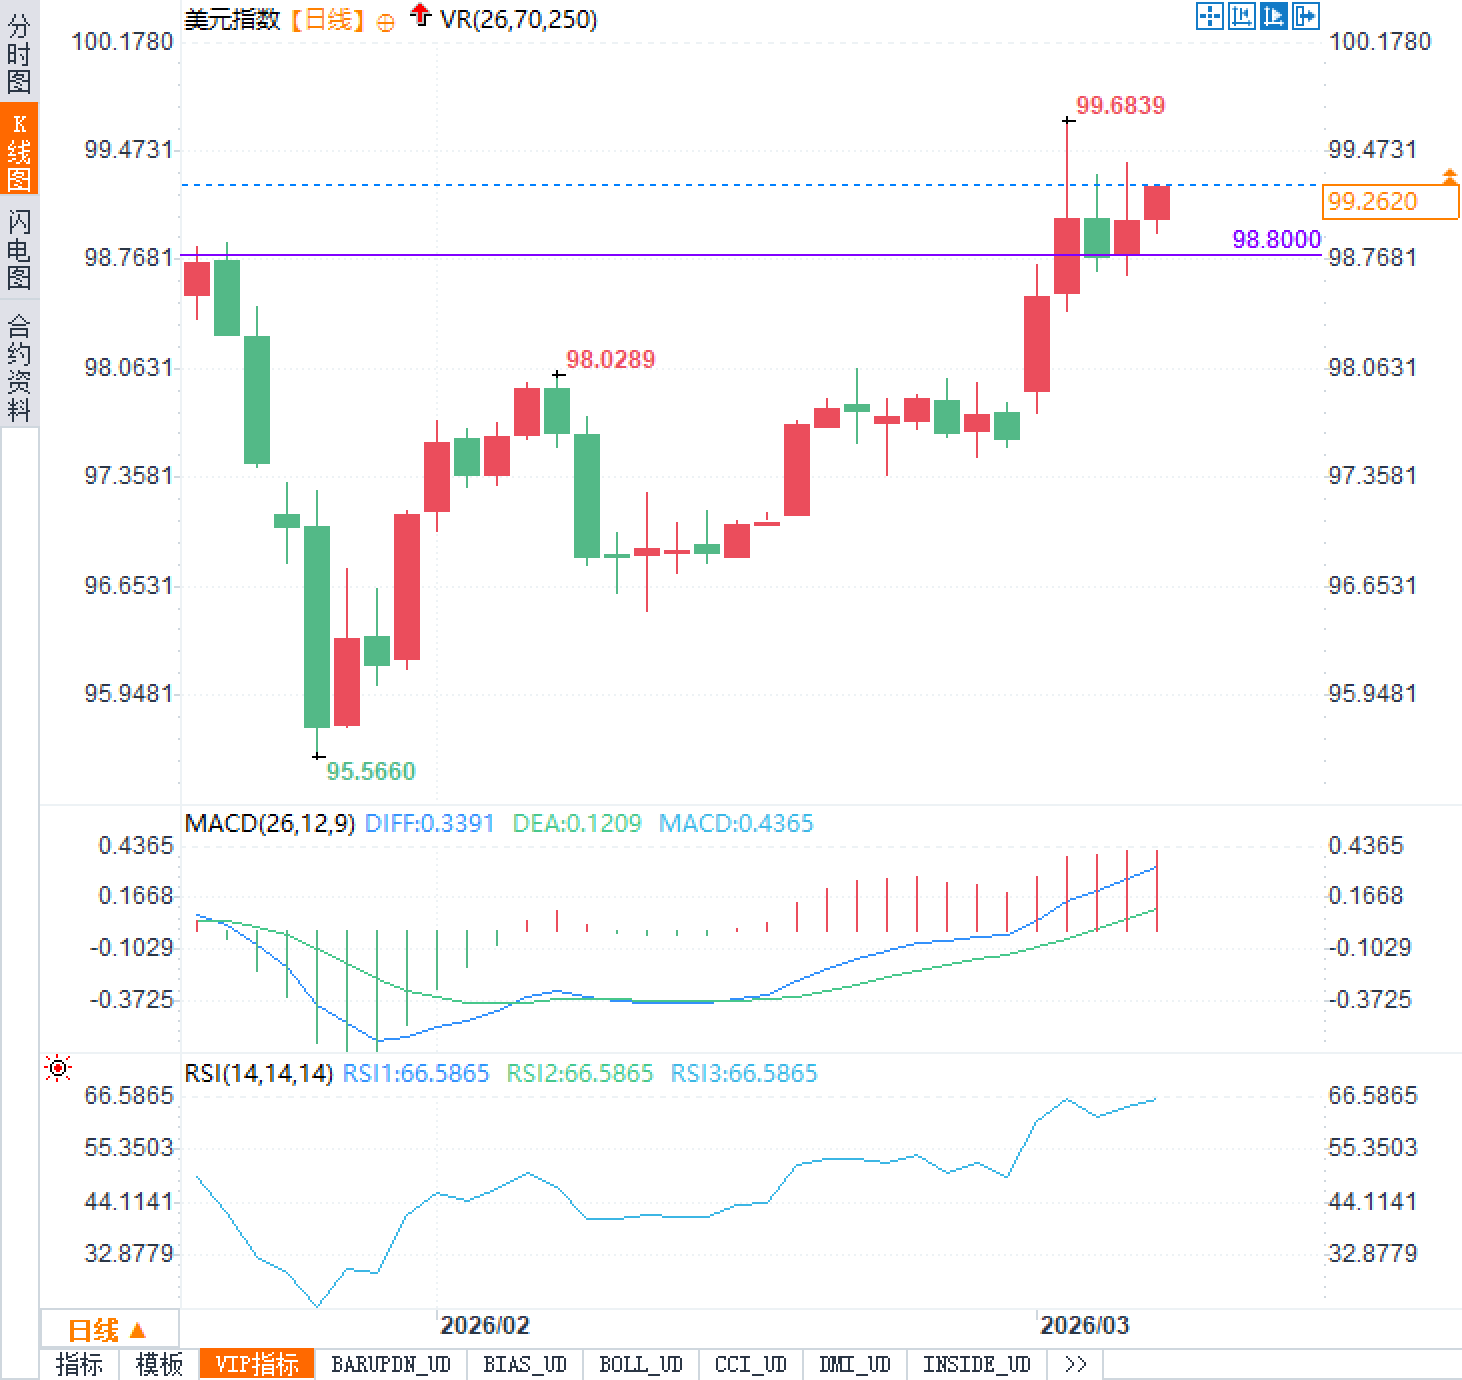
On Friday, March 6th, the February non-farm payrolls report, due to be released during the North American session, will be closely watched. The US dollar index is currently fluctuating around the 99 level, and the 10-year US Treasury yield is hovering around 4.15%. After January's non-farm payrolls increased by 130,000, exceeding expectations, the market is divided on whether the February data will continue the signs of stability.
The recent ADP private sector employment report showed a higher-than-expected increase of 63,000 jobs, with improvements in the employment sub-indices of both the manufacturing and services purchasing managers' indices. Initial jobless claims remained low, all indicating that the labor market has not deteriorated significantly. However, economists predict that non-farm payroll growth in February may slow to near the consensus level, and the unemployment rate is expected to remain stable at 4.3%. In this context, simply focusing on the consensus figures is insufficient; the details of the forecast distribution will become a key factor determining market reactions.

Market reactions to non-farm payroll data often depend not only on the deviation between the actual figure and the consensus, but also on the density and skewness of the forecast distribution. When most forecasts are concentrated in a narrow range, even if the actual data falls within the overall estimate, it may still trigger a significant surprise effect due to deviations from the cluster. This distributional asymmetry amplifies market volatility, especially during periods of heightened interest rate policy sensitivity.
According to the latest market survey, the predicted range for non-farm payroll changes is wide, ranging from -9,000 to 125,000, but the vast majority of predictions are highly clustered in the range of 40,000 to 75,000, with a consensus value of 59,000. This clustering characteristic means that if the actual increase falls below 40,000, even if it is still within the broad range, it may still be interpreted as weaker than expected. Conversely, if it approaches or exceeds the upper limit, it may strengthen the narrative of labor market resilience.
Unemployment rate forecasts also show a clear upward skew. 4.3% is the mainstream expectation, accounting for about 58%, 4.4% has a 36% probability, and 4.2% has a low probability of only 6%. This upward skew indicates that the market is more inclined to believe that the unemployment rate may rise slightly. If the actual data records 4.2%, this would be a significant positive surprise, a favorable economic indicator from a labor market perspective, and could be seen as a hawkish signal, as it suggests that no additional monetary easing is needed to support employment.
The consensus among 85% of respondents was that average hourly earnings would grow by 3.7% year-on-year, indicating a high degree of consensus in the market regarding stable wage inflation pressures. Month-on-month growth was predominantly 0.3%, also accounting for 85% of respondents. The consensus for average weekly working hours was 34.3 hours, with 77% of respondents agreeing. These wage and working hour figures, along with employment figures, will influence assessments of overall economic momentum.
The following is a simplified table of the predicted distribution of key indicators:
The importance of this distribution detail lies in the fact that it helps traders assess the magnitude of their reactions in different scenarios in advance, rather than just relying on point estimates.
Prior to the release of the non-farm payroll report, several high-frequency indicators had already released positive signals, providing some buffer for the February employment situation. The ADP National Employment Report showed that private sector jobs increased by 63,000, significantly higher than market expectations and a substantial rebound from the previous month. This is often correlated with official non-farm payroll data, although the two differ in their coverage and methodology.
The employment component of the Purchasing Managers' Index (PMI) is also noteworthy. The manufacturing employment index rose from 48.1 to 48.8, still in contraction territory but showing significant improvement. The services employment index jumped from 50.3 to 51.8, successfully crossing the 50-point threshold, reflecting a recovery in hiring activity in the service sector. The service sector accounts for more than two-thirds of the US economy, and its employment improvement is a significant indicator of the overall labor market.
Initial jobless claims remained around 208,000 during the survey week, while continuing claims fell to 1.822 million, the lowest level since September of last year. These data suggest that while hiring may be slowing, layoffs remain low, and the labor market adjustment is relatively mild rather than drastic. Considering these leading indicators, the probability of an extremely negative surprise in the February non-farm payroll data has decreased, but whether the increase will meet or exceed consensus remains uncertain. If wage data maintains the expected growth rate, it will further solidify market judgments on the inflation path and avoid concerns about a wage-price spiral.
In a public speech in late February, Federal Reserve Governor Waller explicitly stated that if February's employment data could replicate January's strong performance, he might adjust his views on monetary policy. The significant increase in nonfarm payrolls in January, coupled with a stable unemployment rate, prompted some policymakers to reassess the extent of downside risks to the labor market. Waller emphasized that if February's data confirms an improved employment situation and reduced downside risks, then maintaining interest rates at the March meeting and observing subsequent developments would be a reasonable option. He described this scenario as a key turning point for policy decisions.
This statement places the non-farm payroll report at the heart of the Fed's policy debate. The market has already priced in the number of rate cuts this year compared to the beginning of the year; strong data will further postpone expectations of easing, while weak data could reignite discussions about premature action. Waller's view reflects the Fed's internal consideration of balancing the dual mandates of employment and inflation: ensuring maximum employment while being wary of the risk of renewed inflation acceleration. Wage growth exceeding the consensus of 3.7%, or the unemployment rate falling below 4.3%, could reinforce this hawkish interpretation, despite the continued global uncertainties affecting the overall economy.
The recent ADP private sector employment report showed a higher-than-expected increase of 63,000 jobs, with improvements in the employment sub-indices of both the manufacturing and services purchasing managers' indices. Initial jobless claims remained low, all indicating that the labor market has not deteriorated significantly. However, economists predict that non-farm payroll growth in February may slow to near the consensus level, and the unemployment rate is expected to remain stable at 4.3%. In this context, simply focusing on the consensus figures is insufficient; the details of the forecast distribution will become a key factor determining market reactions.
Detailed Explanation of Non-Farm Employment Forecast Distribution
Market reactions to non-farm payroll data often depend not only on the deviation between the actual figure and the consensus, but also on the density and skewness of the forecast distribution. When most forecasts are concentrated in a narrow range, even if the actual data falls within the overall estimate, it may still trigger a significant surprise effect due to deviations from the cluster. This distributional asymmetry amplifies market volatility, especially during periods of heightened interest rate policy sensitivity.
According to the latest market survey, the predicted range for non-farm payroll changes is wide, ranging from -9,000 to 125,000, but the vast majority of predictions are highly clustered in the range of 40,000 to 75,000, with a consensus value of 59,000. This clustering characteristic means that if the actual increase falls below 40,000, even if it is still within the broad range, it may still be interpreted as weaker than expected. Conversely, if it approaches or exceeds the upper limit, it may strengthen the narrative of labor market resilience.
Unemployment rate forecasts also show a clear upward skew. 4.3% is the mainstream expectation, accounting for about 58%, 4.4% has a 36% probability, and 4.2% has a low probability of only 6%. This upward skew indicates that the market is more inclined to believe that the unemployment rate may rise slightly. If the actual data records 4.2%, this would be a significant positive surprise, a favorable economic indicator from a labor market perspective, and could be seen as a hawkish signal, as it suggests that no additional monetary easing is needed to support employment.
The consensus among 85% of respondents was that average hourly earnings would grow by 3.7% year-on-year, indicating a high degree of consensus in the market regarding stable wage inflation pressures. Month-on-month growth was predominantly 0.3%, also accounting for 85% of respondents. The consensus for average weekly working hours was 34.3 hours, with 77% of respondents agreeing. These wage and working hour figures, along with employment figures, will influence assessments of overall economic momentum.
The following is a simplified table of the predicted distribution of key indicators:
| index | Consensus value | Main distribution or probability |
|---|---|---|
| Changes in non-farm employment (in ten thousands) | 5.9 | Range: -0.9 to 12.5, with the most clustered range being 4 to 7.5. |
| unemployment rate(%) | 4.3 | 4.3 (58%), 4.4 (36%), 4.2 (6%) |
| Average hourly wage year-on-year (%) | 3.7 | 3.7 (85%) |
| Average hourly earnings month-on-month change (%) | 0.3 | 0.3 (85%) |
| Average weekly working hours (hours) | 34.3 | 34.3 (77%) |
Recent employment indicators provide positive support.
Prior to the release of the non-farm payroll report, several high-frequency indicators had already released positive signals, providing some buffer for the February employment situation. The ADP National Employment Report showed that private sector jobs increased by 63,000, significantly higher than market expectations and a substantial rebound from the previous month. This is often correlated with official non-farm payroll data, although the two differ in their coverage and methodology.
The employment component of the Purchasing Managers' Index (PMI) is also noteworthy. The manufacturing employment index rose from 48.1 to 48.8, still in contraction territory but showing significant improvement. The services employment index jumped from 50.3 to 51.8, successfully crossing the 50-point threshold, reflecting a recovery in hiring activity in the service sector. The service sector accounts for more than two-thirds of the US economy, and its employment improvement is a significant indicator of the overall labor market.
Initial jobless claims remained around 208,000 during the survey week, while continuing claims fell to 1.822 million, the lowest level since September of last year. These data suggest that while hiring may be slowing, layoffs remain low, and the labor market adjustment is relatively mild rather than drastic. Considering these leading indicators, the probability of an extremely negative surprise in the February non-farm payroll data has decreased, but whether the increase will meet or exceed consensus remains uncertain. If wage data maintains the expected growth rate, it will further solidify market judgments on the inflation path and avoid concerns about a wage-price spiral.
Federal Reserve officials' statements are linked to the policy path.
In a public speech in late February, Federal Reserve Governor Waller explicitly stated that if February's employment data could replicate January's strong performance, he might adjust his views on monetary policy. The significant increase in nonfarm payrolls in January, coupled with a stable unemployment rate, prompted some policymakers to reassess the extent of downside risks to the labor market. Waller emphasized that if February's data confirms an improved employment situation and reduced downside risks, then maintaining interest rates at the March meeting and observing subsequent developments would be a reasonable option. He described this scenario as a key turning point for policy decisions.
This statement places the non-farm payroll report at the heart of the Fed's policy debate. The market has already priced in the number of rate cuts this year compared to the beginning of the year; strong data will further postpone expectations of easing, while weak data could reignite discussions about premature action. Waller's view reflects the Fed's internal consideration of balancing the dual mandates of employment and inflation: ensuring maximum employment while being wary of the risk of renewed inflation acceleration. Wage growth exceeding the consensus of 3.7%, or the unemployment rate falling below 4.3%, could reinforce this hawkish interpretation, despite the continued global uncertainties affecting the overall economy.
Frequently Asked Questions
Question 1: What unique impact do the clustering characteristics of non-farm payroll forecast distributions have on market reactions?
A: The clustering effect means that even if the actual data falls in the middle of the forecast range, a significant surprise effect can still occur if it deviates from the 40,000 to 75,000 range where most analysts converge. This asymmetry amplifies the volatility potential because market pricing already incorporates cluster expectations. Traders need to focus on the deviation of the actual value from the cluster median, rather than simply comparing it to the broader range. This helps in more accurately assessing the immediate impact of the data on the yield curve and exchange rates.
Question 2: What does an upward skew in the unemployment rate forecast mean, and how will low unemployment rate data be interpreted?
A: The upward skew indicates that the market is more prepared to accept a higher unemployment rate of 4.4%, while the probability of a lower unemployment rate of 4.2% is only 6%. Therefore, if the actual figure is 4.2%, this would be considered a stronger-than-expected employment performance, constituting a hawkish surprise from a policy perspective, suggesting that the labor market is more resilient than expected, which may reduce the urgency for further easing by the Federal Reserve. Conversely, if it rises to 4.4%, it is more in line with some expectations, and the market reaction may be relatively mild. This highlights the crucial role of distribution details in judging the nature of a "surprise" in the data.
Question 3: How have Governor Waller's recent comments changed the framework for interpreting the February non-farm payroll report?
A: Waller explicitly linked the February data to the March policy decision. If the employment indicators continue the improvement seen in January, he is inclined to pause rate cuts to observe inflation progress. This statement elevates the report's importance, making it not just an economic snapshot but also a policy signal. The market is therefore paying more attention to the combined performance of employment figures, the unemployment rate, and wages, rather than a single indicator. Strong data could reinforce expectations of longer-term interest rates, impacting bond pricing and the dollar's trajectory, while weak data could restart a pricing cycle for easing.
- Risk Warning and Disclaimer
- The market involves risk, and trading may not be suitable for all investors. This article is for reference only and does not constitute personal investment advice, nor does it take into account certain users’ specific investment objectives, financial situation, or other needs. Any investment decisions made based on this information are at your own risk.