


The Battle for Gold at $5,000: Is the Super Bull Market Facing a Critical Test?
2026-03-17 01:53:02
On Monday (March 16), the international gold market was at a delicate and crucial moment. Since the beginning of the year, gold prices have risen sharply against the backdrop of global geopolitical conflicts, continued central bank gold purchases, and rising uncertainty in the dollar system. Spot gold (XAU/USD) once broke through historical highs, rising above $5,600. However, after the rapid rise, gold prices have recently experienced a significant pullback and are currently struggling to hold the important psychological level of $5,000.

From a longer-term perspective, gold remains in a supercycle driven by central bank demand, changes in the global reserve structure, and macroeconomic uncertainties. However, the short-term market environment is changing: profit-taking, margin calls in some markets, and a temporary strengthening of the US dollar are all putting downward pressure on gold prices. For investors who have been accustomed to "buying on dips" over the past few months, this is the first time they have encountered such significant selling pressure since the start of this rally, and it also signals a potential turning point in gold's technical structure.
Liquidity pressures emerge: Safe-haven assets experience rare simultaneous pressure.
The current decline in gold prices has attracted attention because it deviates to some extent from the traditional logic of safe-haven assets.
Typically, escalating tensions in the Middle East and increased energy supply risks drive safe-haven flows into gold. However, in the recent market environment, even as the Iranian conflict continues to impact global energy supplies and push up oil prices, gold has failed to rise in tandem, instead experiencing a decline. This unusual trend is rare in history.
One key reason is that the market is experiencing a period of tightening liquidity. When some risky assets experience significant volatility, investors often need to sell the most liquid assets to cover losses in other areas, and gold happens to be one of these highly liquid assets. Therefore, in certain extreme situations, gold may also be sold off to meet funding needs.
Historically, such "passive selling" is often a short-term phenomenon. Once market sentiment stabilizes, gold typically returns to its long-term trend driven by macroeconomic fundamentals. Therefore, for investors who can ignore short-term fluctuations and focus on long-term asset allocation, this periodic adjustment often presents new investment opportunities.
Federal Reserve policy becomes a key variable: Why $5,000 is so important
The biggest variable facing the gold market this week comes from the Federal Reserve. The upcoming FOMC meeting on March 18th could be a crucial event determining the short-term direction of gold prices.
Recent disruptions to shipping in the Strait of Hormuz have pushed up energy prices, leading to a renewed rise in global inflation expectations. As a result, market expectations for a rapid interest rate cut by the Federal Reserve have cooled significantly. According to interest rate futures market pricing, the probability of the Fed maintaining interest rates in the 3.50%-3.75% range at this meeting is now close to 100%.
Changes in interest rate expectations directly drive the dollar higher, while gold itself does not generate interest and has a relatively higher cost of holding it in a high-interest-rate environment, thus reducing its short-term attractiveness.
However, from a longer-term perspective, gold still has a significant supporting force – global central bank demand. In recent years, emerging market central banks have been continuously increasing their gold reserves to reduce their dependence on dollar assets. Some institutions estimate that global central banks' monthly gold purchases are around 70 tons. This stable and long-term demand provides gold with a "structural buying" situation rarely seen in past cycles.
In other words, even if the Federal Reserve delays its rate cuts until June or even September of this year, central bank demand may still largely buffer the downward pressure on gold, keeping its overall bull market structure stable.
Technical structure changes: A downward channel is gradually forming.
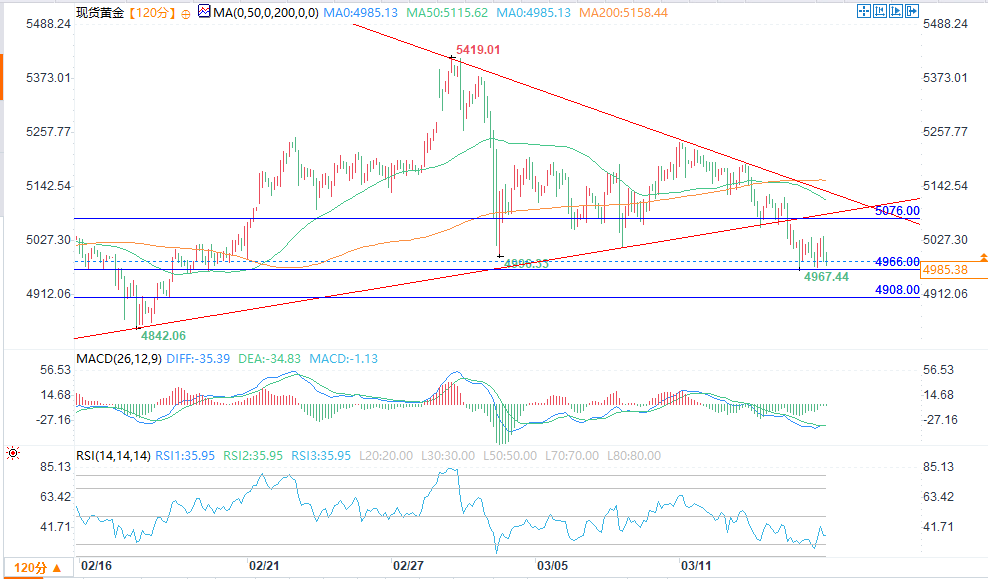
(Spot gold daily chart source: FX678)
From a technical perspective, gold's short-term trend has shown clear signs of weakening.
On the 2-hour and 4-hour charts, gold prices have broken below the 50-period and 200-period moving averages, which are now turning into new resistance levels. Meanwhile, prices are moving along a gradually clarifying descending channel, consistently forming lower highs below the $5320 trendline.
$5,064 was originally an important support level, and the fact that this level was effectively broken means that the short-term market initiative has shifted to the bears.
In terms of momentum indicators, the Relative Strength Index (RSI) is currently hovering around 35, approaching oversold territory. However, in a rapid correction, the RSI often continues to decline after entering oversold territory before a truly sustainable rebound occurs.
If gold prices break below and stabilize below $5,000 on the daily chart, the next technical target could be around $4,908 – a potential area of concentrated liquidity. Conversely, a strong rebound around $4,960 and a move back above $5,060 could indicate that the bulls are regrouping.
The key technical levels currently attracting market attention include:
Key resistance levels: $5064 (former support now resistance), $5129
Key support level: $4966, followed by structural support at $4908.
Trend assessment: As long as gold prices remain below $5117 (200-period moving average), the short-term technical outlook remains bearish.
It's worth noting that near key psychological levels, the market often experiences "false breakouts." For example, a long lower shadow candlestick forming below $5,000 often indicates that institutional funds are taking advantage of market panic to accumulate shares.
Weekly Outlook: Market May Enter a Period of High Volatility
The gold market is likely to enter a period of significantly increased volatility during the week of March 16-22, 2026.
If the Federal Reserve sends a more hawkish signal, gold prices may fall further and test the $4,800 area; however, if the policy stance is dovish, or the market reprices the future path of interest rate cuts, gold may rebound quickly and retest the $5,200 level.
It is worth noting that although short-term technical signals are slightly bearish, from a longer time frame perspective, gold has accumulated a gain of nearly 70% over the past year, and the overall bull market structure has not been broken.
In the current market environment, the high volatility of the paper gold and futures markets can easily amplify investor sentiment, while true trends are often driven by longer-term factors. Continued gold purchases by global central banks, geopolitical uncertainty, and structural changes in the international reserve system remain important forces supporting gold prices.
Therefore, whether for short-term traders or long-term investors, $5,000 will be a key watershed to watch in the gold market in 2026.
From a longer-term perspective, gold remains in a supercycle driven by central bank demand, changes in the global reserve structure, and macroeconomic uncertainties. However, the short-term market environment is changing: profit-taking, margin calls in some markets, and a temporary strengthening of the US dollar are all putting downward pressure on gold prices. For investors who have been accustomed to "buying on dips" over the past few months, this is the first time they have encountered such significant selling pressure since the start of this rally, and it also signals a potential turning point in gold's technical structure.
Liquidity pressures emerge: Safe-haven assets experience rare simultaneous pressure.
The current decline in gold prices has attracted attention because it deviates to some extent from the traditional logic of safe-haven assets.
Typically, escalating tensions in the Middle East and increased energy supply risks drive safe-haven flows into gold. However, in the recent market environment, even as the Iranian conflict continues to impact global energy supplies and push up oil prices, gold has failed to rise in tandem, instead experiencing a decline. This unusual trend is rare in history.
One key reason is that the market is experiencing a period of tightening liquidity. When some risky assets experience significant volatility, investors often need to sell the most liquid assets to cover losses in other areas, and gold happens to be one of these highly liquid assets. Therefore, in certain extreme situations, gold may also be sold off to meet funding needs.
Historically, such "passive selling" is often a short-term phenomenon. Once market sentiment stabilizes, gold typically returns to its long-term trend driven by macroeconomic fundamentals. Therefore, for investors who can ignore short-term fluctuations and focus on long-term asset allocation, this periodic adjustment often presents new investment opportunities.
Federal Reserve policy becomes a key variable: Why $5,000 is so important
The biggest variable facing the gold market this week comes from the Federal Reserve. The upcoming FOMC meeting on March 18th could be a crucial event determining the short-term direction of gold prices.
Recent disruptions to shipping in the Strait of Hormuz have pushed up energy prices, leading to a renewed rise in global inflation expectations. As a result, market expectations for a rapid interest rate cut by the Federal Reserve have cooled significantly. According to interest rate futures market pricing, the probability of the Fed maintaining interest rates in the 3.50%-3.75% range at this meeting is now close to 100%.
Changes in interest rate expectations directly drive the dollar higher, while gold itself does not generate interest and has a relatively higher cost of holding it in a high-interest-rate environment, thus reducing its short-term attractiveness.
However, from a longer-term perspective, gold still has a significant supporting force – global central bank demand. In recent years, emerging market central banks have been continuously increasing their gold reserves to reduce their dependence on dollar assets. Some institutions estimate that global central banks' monthly gold purchases are around 70 tons. This stable and long-term demand provides gold with a "structural buying" situation rarely seen in past cycles.
In other words, even if the Federal Reserve delays its rate cuts until June or even September of this year, central bank demand may still largely buffer the downward pressure on gold, keeping its overall bull market structure stable.
Technical structure changes: A downward channel is gradually forming.
(Spot gold daily chart source: FX678)
From a technical perspective, gold's short-term trend has shown clear signs of weakening.
On the 2-hour and 4-hour charts, gold prices have broken below the 50-period and 200-period moving averages, which are now turning into new resistance levels. Meanwhile, prices are moving along a gradually clarifying descending channel, consistently forming lower highs below the $5320 trendline.
$5,064 was originally an important support level, and the fact that this level was effectively broken means that the short-term market initiative has shifted to the bears.
In terms of momentum indicators, the Relative Strength Index (RSI) is currently hovering around 35, approaching oversold territory. However, in a rapid correction, the RSI often continues to decline after entering oversold territory before a truly sustainable rebound occurs.
If gold prices break below and stabilize below $5,000 on the daily chart, the next technical target could be around $4,908 – a potential area of concentrated liquidity. Conversely, a strong rebound around $4,960 and a move back above $5,060 could indicate that the bulls are regrouping.
The key technical levels currently attracting market attention include:
Key resistance levels: $5064 (former support now resistance), $5129
Key support level: $4966, followed by structural support at $4908.
Trend assessment: As long as gold prices remain below $5117 (200-period moving average), the short-term technical outlook remains bearish.
It's worth noting that near key psychological levels, the market often experiences "false breakouts." For example, a long lower shadow candlestick forming below $5,000 often indicates that institutional funds are taking advantage of market panic to accumulate shares.
Weekly Outlook: Market May Enter a Period of High Volatility
The gold market is likely to enter a period of significantly increased volatility during the week of March 16-22, 2026.
If the Federal Reserve sends a more hawkish signal, gold prices may fall further and test the $4,800 area; however, if the policy stance is dovish, or the market reprices the future path of interest rate cuts, gold may rebound quickly and retest the $5,200 level.
It is worth noting that although short-term technical signals are slightly bearish, from a longer time frame perspective, gold has accumulated a gain of nearly 70% over the past year, and the overall bull market structure has not been broken.
In the current market environment, the high volatility of the paper gold and futures markets can easily amplify investor sentiment, while true trends are often driven by longer-term factors. Continued gold purchases by global central banks, geopolitical uncertainty, and structural changes in the international reserve system remain important forces supporting gold prices.
Therefore, whether for short-term traders or long-term investors, $5,000 will be a key watershed to watch in the gold market in 2026.
- Risk Warning and Disclaimer
- The market involves risk, and trading may not be suitable for all investors. This article is for reference only and does not constitute personal investment advice, nor does it take into account certain users’ specific investment objectives, financial situation, or other needs. Any investment decisions made based on this information are at your own risk.
