Brent crude surged while WTI crude plummeted, and gold plunged nearly $100! The market ignored the weak dollar, focusing solely on fear.
2026-03-18 20:16:25
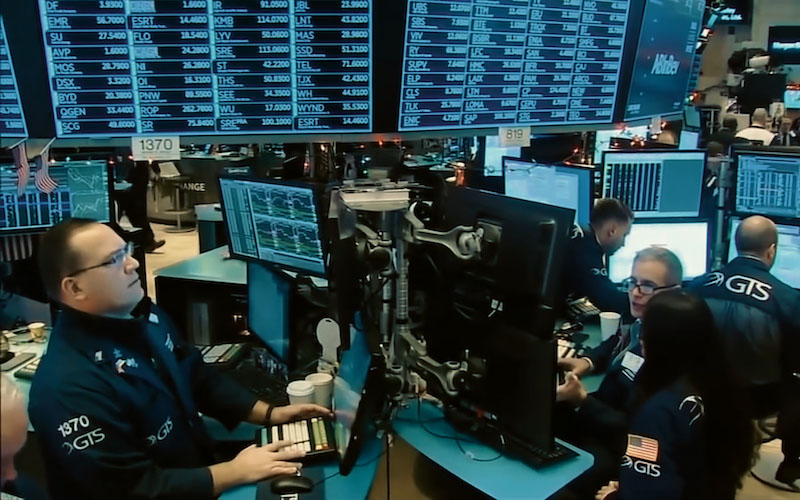
On Wednesday (March 18), the global commodities and foreign exchange markets exhibited a significant divergence, with geopolitical factors, inventory data, and policy expectations intertwined to dominate short-term asset price movements. The energy market premium logic underwent subtle changes due to the ongoing evolution of the Russia-Ukraine situation and the continued obstruction of the Strait of Hormuz, a key shipping route in the Middle East. Currently, the core market drivers are focused on three aspects: first, the supply-side disruptions caused by the partial reopening of Iraqi export routes and the unexpected increase in US crude oil inventories; second, the interplay between safe-haven demand and inflation expectations triggered by the upcoming Federal Reserve interest rate decision; and third, the actual progress made by major oil-producing countries in alleviating supply pressure through alternative shipping routes.
Against this backdrop, market sentiment exhibited a "cautious volatility." The divergence between Brent and WTI crude oil prices reflected a disconnect between international benchmarks and the supply and demand structure in the United States; while spot gold recorded a significant decline despite a slight weakening of the US dollar, indicating that the attractiveness of safe-haven assets is facing a severe challenge from rising real interest rates under the pressure of high interest rate expectations.
The most striking phenomenon in the current crude oil market is the divergence between Brent crude and West Texas Intermediate (WTI) crude. As of the latest trading session, Brent crude closed at $104.18, a gain of 0.59%, while WTI crude fell 1.04% to close at $94.54, widening the price difference to $9.64.
This divergence stems from fundamental differences. Brent crude, as a global benchmark, is more sensitive to the situation in the Middle East and the potential blockade of the Strait of Hormuz. Although reports from prominent institutions indicate an agreement between the Iraqi government and Kurdish authorities to resume exports through Turkey's Ceyhan port on March 18, which has alleviated short-term supply concerns to some extent, the floor support for Brent crude remains strong as long as the strategic chokepoint of the Strait of Hormuz remains unopened.
In contrast, US crude oil prices were significantly dragged down by domestic factors in the United States. The latest API data shows that US crude oil inventories increased by approximately 6.6 million barrels last week. This, coupled with Saudi Arabia's significant increase in exports to 3.8 million barrels per day through the Yanbu port on the Red Sea and the use of drag-reducing agents (DRA) to improve pipeline transportation efficiency, effectively alleviated supply pressure on non-Hormuz routes.
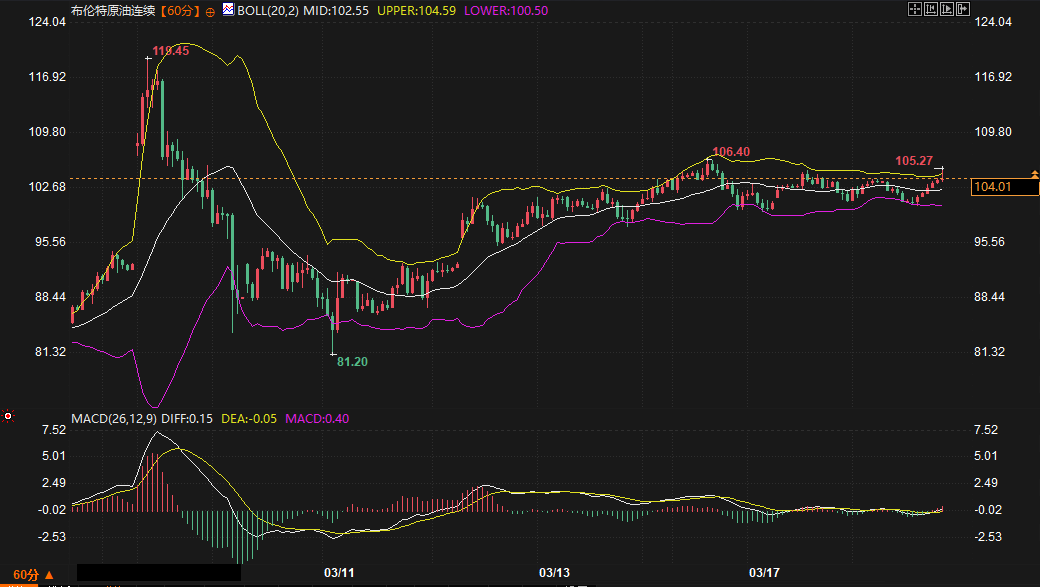
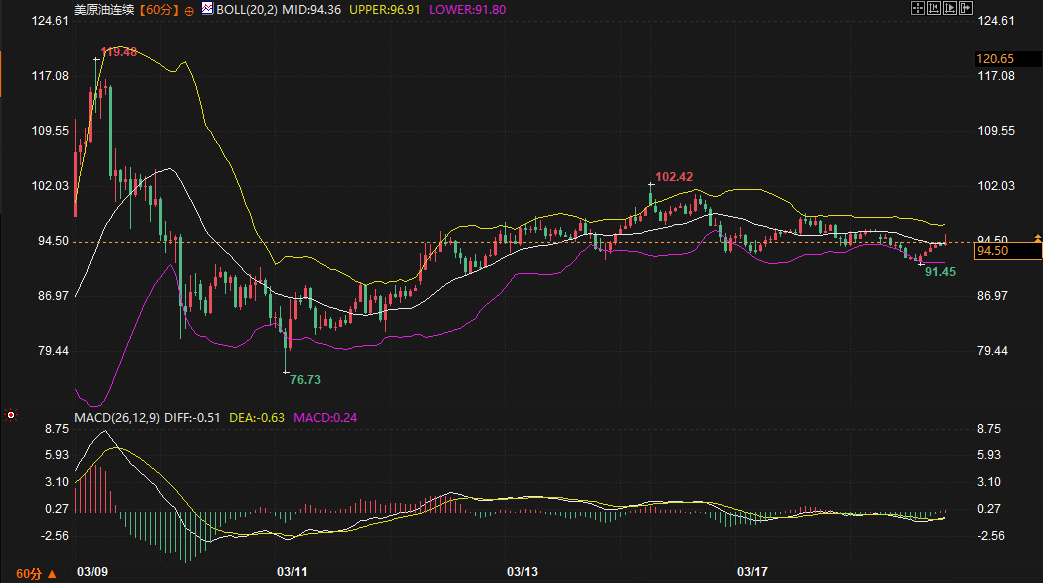
From a technical perspective, Brent crude oil has broken above the Bollinger Band middle line (102.55) on the 60-minute chart, and the MACD golden cross signal indicates that bullish momentum is still emerging. Short-term resistance is located between 104.59 (upper Bollinger Band) and 106.40 (previous high), with strong support around 100.50. WTI crude oil, on the other hand, is weaker, constrained by the Bollinger Band middle line at 94.36. If it cannot effectively hold above this level, it may further test the lower Bollinger Band support at 91.80 in the short term. In the next 2-3 days, oil prices may remain within the current range, awaiting further guidance from the Federal Reserve's decision on inflation expectations.
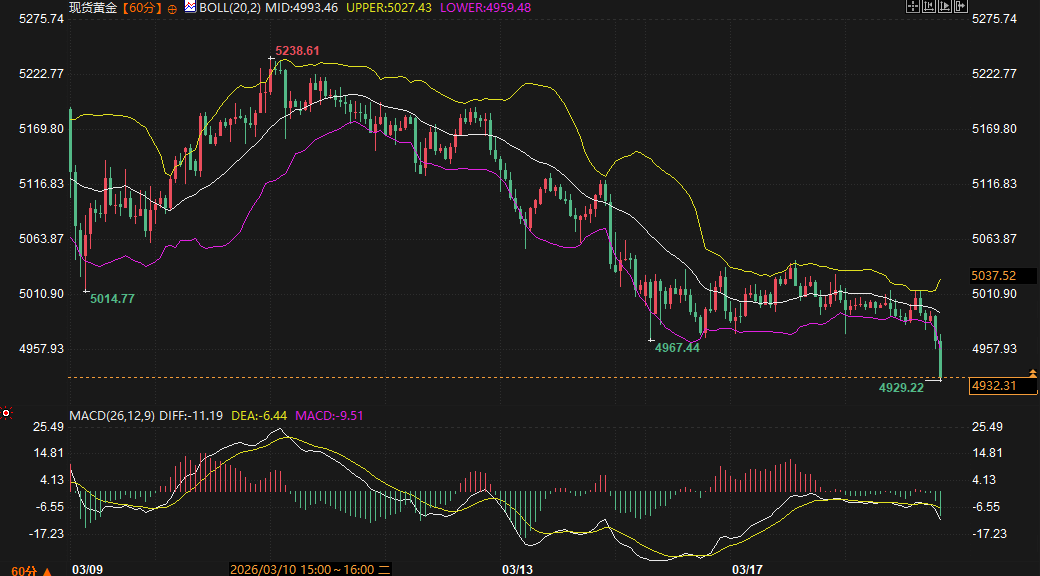
Spot gold continued its downward trend after falling below the $5,000 mark, and is currently down nearly $100 from its opening price. Although the US dollar index did not surge significantly, gold suffered a heavy blow, indicating that the market pricing logic has shifted from simply "safe haven" to pricing in "the continued high-interest-rate environment".
Fundamentally, ahead of the Fed's March meeting, market expectations for a 2026 rate cut were significantly reduced due to sticky inflation caused by high energy prices. The rise in the 2-year Treasury yield reflected a market reassessment of the end of tightening policies, directly increasing the opportunity cost of holding gold. Furthermore, with the smooth progress of alternative export routes in countries like Saudi Arabia, market concerns about systemic financial risks triggered by the energy crisis have decreased, leading to safe-haven outflows from gold.
Technical analysis shows that spot gold is in a clear downward channel. The MACD histogram continues to expand negatively, and the DIFF and DEA lines are in a bearish alignment, indicating that downward pressure has not yet subsided. The price has broken through the lower Bollinger Band (4959.48) and is in technically oversold territory. In the short term, the $4900 level will be a key psychological support. If a rebound occurs, $4993.46 (the middle Bollinger Band) will form the first strong resistance zone, with further resistance at $5027.43. Gold is expected to maintain a weak consolidation over the next 2-3 days, searching for a short-term bottom.
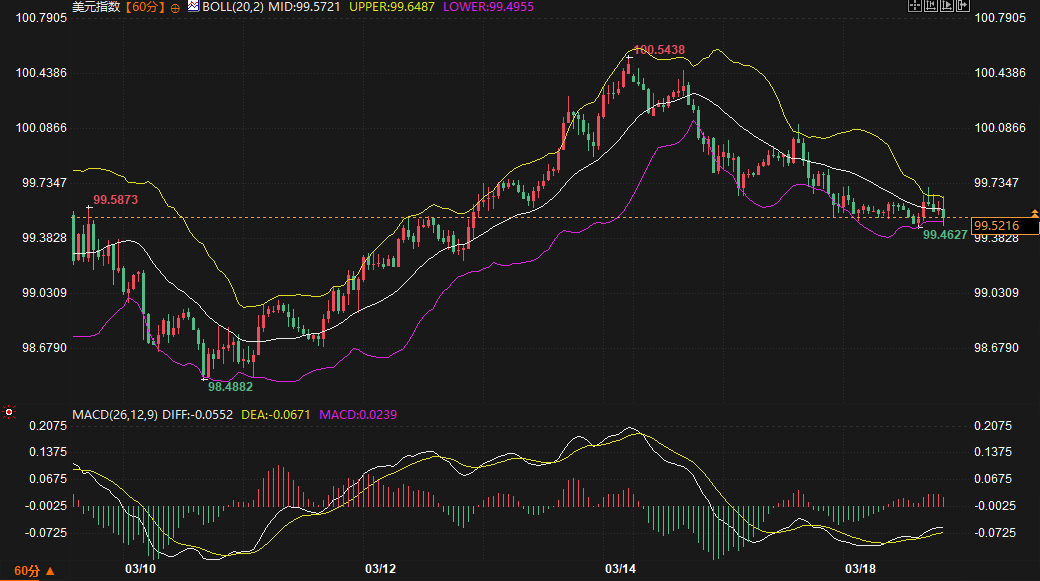
The US Dollar Index (DXY) is currently fluctuating narrowly around 99.54, with a range of only 0.24%. The market is in a wait-and-see mode ahead of the Federal Reserve's decision, with both bulls and bears showing restraint.
The current trend of the US dollar presents a complex contradiction: on the one hand, high inflation expectations and a robust job market provide interest rate differential support for the dollar; on the other hand, a slight recovery in risk appetite (such as rising stock futures) has weakened safe-haven buying of the dollar. Meanwhile, the slight rise in the dollar against the yen reflects the uncertainty surrounding the Bank of Japan's policy path.
From a technical perspective, the US dollar index is below the Bollinger Band middle line (99.57) on the 60-minute chart, indicating a short-term consolidation phase where it may be choosing a direction. While the MACD shows signs of turning positive, momentum is limited. The upper resistance zone is locked at 99.65 to 100.54 (previous high), while the lower support level is at 99.49. In the next 2-3 days, the dollar's movement will depend entirely on Federal Reserve Chairman Powell's statements at the press conference regarding the impact of tariffs and the path of inflation. If the dot plot releases a hawkish signal, the dollar may challenge the 100 mark; otherwise, it may continue to trade sideways in the 99-100 range.
In summary, the market is expected to shift from a "data-driven" to a "policy-driven" model over the next 2-3 days. In the crude oil market, due to unresolved geopolitical risks and increasing inventories, the price divergence between Brent and WTI crude may persist, resulting in wide-range fluctuations in the short term. Gold, with its downward trend still in place, needs to be monitored for a technical correction after being oversold; however, a trend reversal is unlikely before the Fed's decision is finalized. The US dollar will continue to act as an "anchor" for global liquidity, and short-term volatility may surge immediately after the decision is announced. Overall, the market is in a period of high-level risk release, and investors should be wary of the secondary impact of sudden changes in the geopolitical situation on commodity prices.
1. Why have Brent crude oil and WTI crude oil prices diverged so significantly recently?
This is primarily due to a supply-demand mismatch caused by geographical location. Brent crude, as the international benchmark, is heavily influenced by the situation in the Middle East and the blockade of the Strait of Hormuz, resulting in an extremely high geopolitical risk premium. Meanwhile, WTI crude benefits from increased US domestic inventories (such as the 6.6 million barrel increase shown in API data) and expectations that Saudi Arabia and other countries will supply Asia and the US via alternative routes through the Red Sea, leading to a relatively ample supply in the US market and consequently, WTI underperforming Brent crude.
2. Why did gold prices fall sharply despite the continued presence of safe-haven demand?
While the Russia-Ukraine situation and the Middle East conflict provided some safe-haven support, gold is currently facing stronger macroeconomic pressure. Ahead of the Federal Reserve meeting, market expectations for interest rate cuts were significantly revised downwards, and the 2-year US Treasury yield rose, meaning the cost of holding physical gold increased. Furthermore, the resumption of some alternative shipping routes reduced market fears of extreme supply collapses, leading some safe-haven funds to take profits, thus putting downward pressure on gold prices.
3. What are the long-term effects of Saudi Arabia's increased exports from Yanbu Port in the Red Sea on oil prices?
Saudi Arabia has increased exports from Yanbu port to 3.8 million barrels per day and improved pipeline efficiency using drag-reducing agents, strategically offsetting the impact of the Strait of Hormuz closure. This implies that the global oil supply system is more resilient than expected. If this alternative route remains stable, it will gradually weaken the "extreme supply disruption premium" in crude oil prices, limiting the long-term upside potential for oil prices.
4. How will the upcoming Federal Reserve decision affect the dollar's trajectory?
The market's current focus is not only on interest rates themselves, but also on the Federal Reserve's stance on the inflation outlook. If the Fed emphasizes the inflation risks posed by high oil prices and maintains a hawkish stance (i.e., delaying rate cuts), the dollar is likely to gain support and retest the 100 mark. Conversely, if the meeting's focus shifts to concerns about slowing economic growth, the dollar may face downward pressure.
5. What key technical ranges should investors focus on in the next 2-3 days?
For Brent crude, watch the resistance zone of 104.59-106.40 and the support level of 100.50; for WTI crude, watch the resistance at the 94.36 mid-band and the support at 91.80. For gold, the 4900 level is crucial, with resistance at 4993.46. For the US dollar index, watch the 100-point resistance level.
Against this backdrop, market sentiment exhibited a "cautious volatility." The divergence between Brent and WTI crude oil prices reflected a disconnect between international benchmarks and the supply and demand structure in the United States; while spot gold recorded a significant decline despite a slight weakening of the US dollar, indicating that the attractiveness of safe-haven assets is facing a severe challenge from rising real interest rates under the pressure of high interest rate expectations.
Energy Markets: A Game Between Geopolitical Premiums and Supply Easing
The most striking phenomenon in the current crude oil market is the divergence between Brent crude and West Texas Intermediate (WTI) crude. As of the latest trading session, Brent crude closed at $104.18, a gain of 0.59%, while WTI crude fell 1.04% to close at $94.54, widening the price difference to $9.64.
This divergence stems from fundamental differences. Brent crude, as a global benchmark, is more sensitive to the situation in the Middle East and the potential blockade of the Strait of Hormuz. Although reports from prominent institutions indicate an agreement between the Iraqi government and Kurdish authorities to resume exports through Turkey's Ceyhan port on March 18, which has alleviated short-term supply concerns to some extent, the floor support for Brent crude remains strong as long as the strategic chokepoint of the Strait of Hormuz remains unopened.
In contrast, US crude oil prices were significantly dragged down by domestic factors in the United States. The latest API data shows that US crude oil inventories increased by approximately 6.6 million barrels last week. This, coupled with Saudi Arabia's significant increase in exports to 3.8 million barrels per day through the Yanbu port on the Red Sea and the use of drag-reducing agents (DRA) to improve pipeline transportation efficiency, effectively alleviated supply pressure on non-Hormuz routes.
From a technical perspective, Brent crude oil has broken above the Bollinger Band middle line (102.55) on the 60-minute chart, and the MACD golden cross signal indicates that bullish momentum is still emerging. Short-term resistance is located between 104.59 (upper Bollinger Band) and 106.40 (previous high), with strong support around 100.50. WTI crude oil, on the other hand, is weaker, constrained by the Bollinger Band middle line at 94.36. If it cannot effectively hold above this level, it may further test the lower Bollinger Band support at 91.80 in the short term. In the next 2-3 days, oil prices may remain within the current range, awaiting further guidance from the Federal Reserve's decision on inflation expectations.
Spot gold: Facing a dual test of high-level pullback and interest rate pressure.
Spot gold continued its downward trend after falling below the $5,000 mark, and is currently down nearly $100 from its opening price. Although the US dollar index did not surge significantly, gold suffered a heavy blow, indicating that the market pricing logic has shifted from simply "safe haven" to pricing in "the continued high-interest-rate environment".
Fundamentally, ahead of the Fed's March meeting, market expectations for a 2026 rate cut were significantly reduced due to sticky inflation caused by high energy prices. The rise in the 2-year Treasury yield reflected a market reassessment of the end of tightening policies, directly increasing the opportunity cost of holding gold. Furthermore, with the smooth progress of alternative export routes in countries like Saudi Arabia, market concerns about systemic financial risks triggered by the energy crisis have decreased, leading to safe-haven outflows from gold.
Technical analysis shows that spot gold is in a clear downward channel. The MACD histogram continues to expand negatively, and the DIFF and DEA lines are in a bearish alignment, indicating that downward pressure has not yet subsided. The price has broken through the lower Bollinger Band (4959.48) and is in technically oversold territory. In the short term, the $4900 level will be a key psychological support. If a rebound occurs, $4993.46 (the middle Bollinger Band) will form the first strong resistance zone, with further resistance at $5027.43. Gold is expected to maintain a weak consolidation over the next 2-3 days, searching for a short-term bottom.
US Dollar Index: Consolidating Amidst Fluctuations, Awaiting Policy Direction
The US Dollar Index (DXY) is currently fluctuating narrowly around 99.54, with a range of only 0.24%. The market is in a wait-and-see mode ahead of the Federal Reserve's decision, with both bulls and bears showing restraint.
The current trend of the US dollar presents a complex contradiction: on the one hand, high inflation expectations and a robust job market provide interest rate differential support for the dollar; on the other hand, a slight recovery in risk appetite (such as rising stock futures) has weakened safe-haven buying of the dollar. Meanwhile, the slight rise in the dollar against the yen reflects the uncertainty surrounding the Bank of Japan's policy path.
From a technical perspective, the US dollar index is below the Bollinger Band middle line (99.57) on the 60-minute chart, indicating a short-term consolidation phase where it may be choosing a direction. While the MACD shows signs of turning positive, momentum is limited. The upper resistance zone is locked at 99.65 to 100.54 (previous high), while the lower support level is at 99.49. In the next 2-3 days, the dollar's movement will depend entirely on Federal Reserve Chairman Powell's statements at the press conference regarding the impact of tariffs and the path of inflation. If the dot plot releases a hawkish signal, the dollar may challenge the 100 mark; otherwise, it may continue to trade sideways in the 99-100 range.
Future Outlook
In summary, the market is expected to shift from a "data-driven" to a "policy-driven" model over the next 2-3 days. In the crude oil market, due to unresolved geopolitical risks and increasing inventories, the price divergence between Brent and WTI crude may persist, resulting in wide-range fluctuations in the short term. Gold, with its downward trend still in place, needs to be monitored for a technical correction after being oversold; however, a trend reversal is unlikely before the Fed's decision is finalized. The US dollar will continue to act as an "anchor" for global liquidity, and short-term volatility may surge immediately after the decision is announced. Overall, the market is in a period of high-level risk release, and investors should be wary of the secondary impact of sudden changes in the geopolitical situation on commodity prices.
Frequently Asked Questions
1. Why have Brent crude oil and WTI crude oil prices diverged so significantly recently?
This is primarily due to a supply-demand mismatch caused by geographical location. Brent crude, as the international benchmark, is heavily influenced by the situation in the Middle East and the blockade of the Strait of Hormuz, resulting in an extremely high geopolitical risk premium. Meanwhile, WTI crude benefits from increased US domestic inventories (such as the 6.6 million barrel increase shown in API data) and expectations that Saudi Arabia and other countries will supply Asia and the US via alternative routes through the Red Sea, leading to a relatively ample supply in the US market and consequently, WTI underperforming Brent crude.
2. Why did gold prices fall sharply despite the continued presence of safe-haven demand?
While the Russia-Ukraine situation and the Middle East conflict provided some safe-haven support, gold is currently facing stronger macroeconomic pressure. Ahead of the Federal Reserve meeting, market expectations for interest rate cuts were significantly revised downwards, and the 2-year US Treasury yield rose, meaning the cost of holding physical gold increased. Furthermore, the resumption of some alternative shipping routes reduced market fears of extreme supply collapses, leading some safe-haven funds to take profits, thus putting downward pressure on gold prices.
3. What are the long-term effects of Saudi Arabia's increased exports from Yanbu Port in the Red Sea on oil prices?
Saudi Arabia has increased exports from Yanbu port to 3.8 million barrels per day and improved pipeline efficiency using drag-reducing agents, strategically offsetting the impact of the Strait of Hormuz closure. This implies that the global oil supply system is more resilient than expected. If this alternative route remains stable, it will gradually weaken the "extreme supply disruption premium" in crude oil prices, limiting the long-term upside potential for oil prices.
4. How will the upcoming Federal Reserve decision affect the dollar's trajectory?
The market's current focus is not only on interest rates themselves, but also on the Federal Reserve's stance on the inflation outlook. If the Fed emphasizes the inflation risks posed by high oil prices and maintains a hawkish stance (i.e., delaying rate cuts), the dollar is likely to gain support and retest the 100 mark. Conversely, if the meeting's focus shifts to concerns about slowing economic growth, the dollar may face downward pressure.
5. What key technical ranges should investors focus on in the next 2-3 days?
For Brent crude, watch the resistance zone of 104.59-106.40 and the support level of 100.50; for WTI crude, watch the resistance at the 94.36 mid-band and the support at 91.80. For gold, the 4900 level is crucial, with resistance at 4993.46. For the US dollar index, watch the 100-point resistance level.
- Risk Warning and Disclaimer
- The market involves risk, and trading may not be suitable for all investors. This article is for reference only and does not constitute personal investment advice, nor does it take into account certain users’ specific investment objectives, financial situation, or other needs. Any investment decisions made based on this information are at your own risk.