Is a gold price pullback a problem? Are institutions still bullish? The bet between Wall Street and the market has begun.
2026-03-19 16:05:34
Gold, one of the best-performing financial assets over the past year, has seen a recent pullback, but many institutions remain optimistic. On Thursday (March 19), spot gold experienced a sudden pullback during the European session due to selling pressure, currently trading around $4740 per ounce, a daily decline of approximately 1.65%.
State Street gold strategists noted in a report on Tuesday that spot gold prices could retest the $5,500-$5,600/oz range in March if the conflict with Iran escalates further. They believe that geopolitical tensions and the global macroeconomic environment continue to support gold, and give a 35% probability that gold will trade in the $5,500-$6,250/oz range a year from now.
Other institutions, such as JP Morgan, predict that gold prices could reach $6,300 per ounce by the end of 2026, while Deutsche Bank maintains its target of $6,000, indicating that the mainstream view on Wall Street remains optimistic about the long-term upward potential of gold.

Despite weeks of ongoing US-Israeli strikes against Iran, gold, as a traditional safe-haven asset, has underperformed. Since the conflict began, gold prices have fallen by about 7%, having broken through $5,500 at the beginning of the year, but have recently seen a significant pullback.
Experts believe this reflects market concerns about the duration and impact of the conflict, as well as a temporary halt to buying after last year's sharp rise.
Key factors suppressing gold prices in the short term include a volatile US dollar, interest rate uncertainty, and insufficient buying interest. The US dollar index is projected to fall by more than 9% in 2025, marking its worst annual performance since 2017, and will hit a four-year low in January 2026. During Thursday's European session, the US dollar index fluctuated lower and is currently trading around 100.10, down about 0.2% on the day, after previously touching a one-and-a-half-month low of $4748.21 per ounce.
Despite the recent surge in the US dollar due to the conflict with Iran, State Street believes the Wall Street consensus is that the dollar will fall another 3% this year, which will stimulate international demand for dollar-denominated gold. Furthermore, while soaring oil prices have temporarily delayed expectations of interest rate cuts, most investors still anticipate the Federal Reserve will resume its rate-cutting cycle this year.
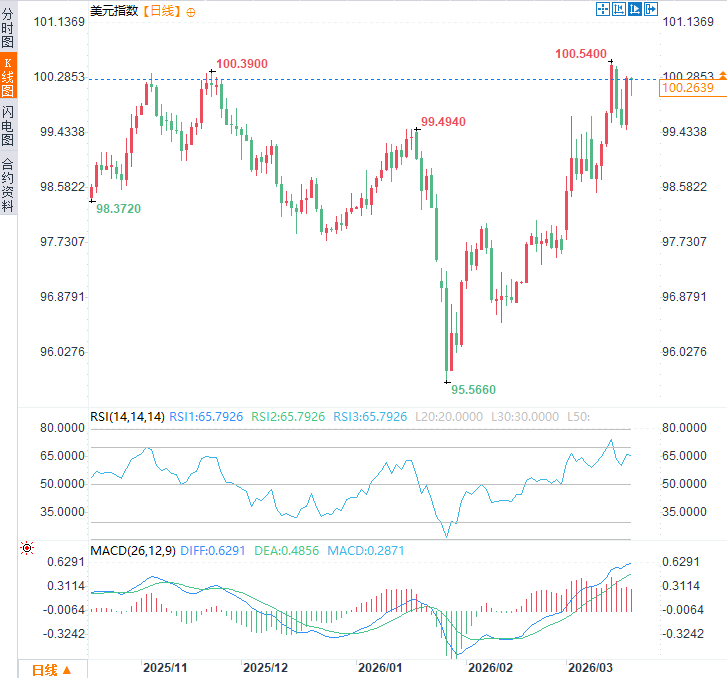
(US Dollar Index Daily Chart, Source: FX678)
If the interest rate path becomes clear and tends to decline, the opportunity cost of holding gold will be significantly reduced (gold does not generate interest, unlike interest-bearing bonds). State Street predicts that once expectations of interest rate cuts are rekindled, a positive feedback loop will be triggered: funds will flow into gold funds, physical market supply will tighten, and prices will rise further.
In the first two months of 2026, US-listed gold ETFs saw net inflows of $10.5 billion, a surge of 67% year-on-year (compared to $6.3 billion in the same period last year). Despite the strong inflows, gold funds still account for less than 1% of global ETF and mutual fund assets, indicating that gold is still considered an underweight asset in institutional portfolios.
Not all opinions are aligned. A Bank of America global fund manager survey in March showed that 35% of respondents considered "bullish gold" the most crowded trade on Wall Street, marking the third consecutive month it has topped the list. A net 38% of respondents believed gold was overpriced (compared to 31% in February), and this increased crowding could limit short-term upside potential, explaining the recent relatively modest performance of gold prices.
The gold market is currently at a critical juncture in the battle between bulls and bears: geopolitical conflicts and the potential weakening of the US dollar provide long-term support, while expectations of a Fed rate cut and strong ETF inflows strengthen the buying base; however, crowded trade warnings and a short-term rebound in the US dollar pose resistance.
Overall, structural demand (such as central bank and institutional allocations) remains dominant, and the pullback may be a consolidation phase for higher levels rather than a trend reversal. Investors need to closely monitor developments in the Iranian situation, the US dollar index, and signals from the Federal Reserve to determine whether the safe-haven logic has restarted.
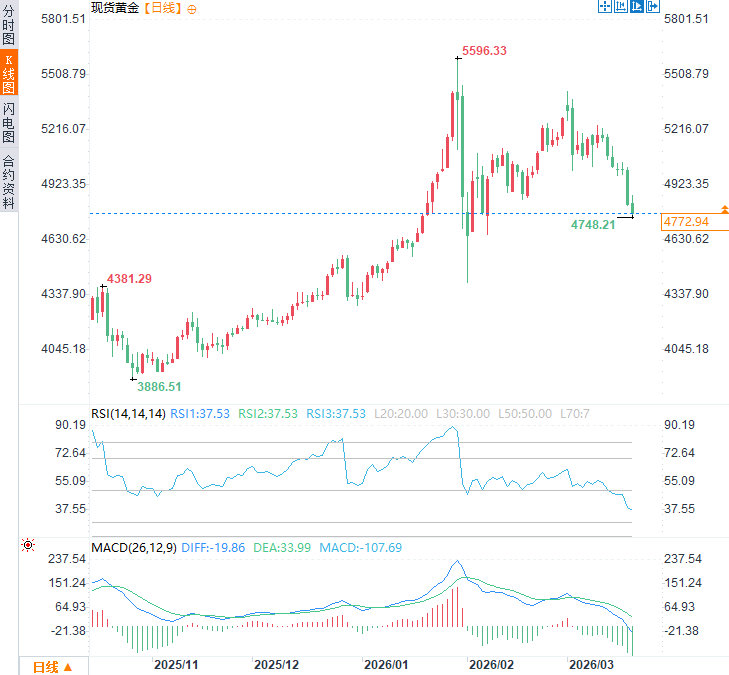
(Spot gold daily chart, source: FX678)
At 16:04 Beijing time, spot gold was trading at $4737.40 per ounce.
State Street gold strategists noted in a report on Tuesday that spot gold prices could retest the $5,500-$5,600/oz range in March if the conflict with Iran escalates further. They believe that geopolitical tensions and the global macroeconomic environment continue to support gold, and give a 35% probability that gold will trade in the $5,500-$6,250/oz range a year from now.
Other institutions, such as JP Morgan, predict that gold prices could reach $6,300 per ounce by the end of 2026, while Deutsche Bank maintains its target of $6,000, indicating that the mainstream view on Wall Street remains optimistic about the long-term upward potential of gold.
Current gold price movements and geopolitical influences
Despite weeks of ongoing US-Israeli strikes against Iran, gold, as a traditional safe-haven asset, has underperformed. Since the conflict began, gold prices have fallen by about 7%, having broken through $5,500 at the beginning of the year, but have recently seen a significant pullback.
Experts believe this reflects market concerns about the duration and impact of the conflict, as well as a temporary halt to buying after last year's sharp rise.
Short-term downward pressure from factors such as the US dollar
Key factors suppressing gold prices in the short term include a volatile US dollar, interest rate uncertainty, and insufficient buying interest. The US dollar index is projected to fall by more than 9% in 2025, marking its worst annual performance since 2017, and will hit a four-year low in January 2026. During Thursday's European session, the US dollar index fluctuated lower and is currently trading around 100.10, down about 0.2% on the day, after previously touching a one-and-a-half-month low of $4748.21 per ounce.
Despite the recent surge in the US dollar due to the conflict with Iran, State Street believes the Wall Street consensus is that the dollar will fall another 3% this year, which will stimulate international demand for dollar-denominated gold. Furthermore, while soaring oil prices have temporarily delayed expectations of interest rate cuts, most investors still anticipate the Federal Reserve will resume its rate-cutting cycle this year.
(US Dollar Index Daily Chart, Source: FX678)
Interest Rate Outlook and ETF Inflows
If the interest rate path becomes clear and tends to decline, the opportunity cost of holding gold will be significantly reduced (gold does not generate interest, unlike interest-bearing bonds). State Street predicts that once expectations of interest rate cuts are rekindled, a positive feedback loop will be triggered: funds will flow into gold funds, physical market supply will tighten, and prices will rise further.
In the first two months of 2026, US-listed gold ETFs saw net inflows of $10.5 billion, a surge of 67% year-on-year (compared to $6.3 billion in the same period last year). Despite the strong inflows, gold funds still account for less than 1% of global ETF and mutual fund assets, indicating that gold is still considered an underweight asset in institutional portfolios.
Congested Transaction Warning
Not all opinions are aligned. A Bank of America global fund manager survey in March showed that 35% of respondents considered "bullish gold" the most crowded trade on Wall Street, marking the third consecutive month it has topped the list. A net 38% of respondents believed gold was overpriced (compared to 31% in February), and this increased crowding could limit short-term upside potential, explaining the recent relatively modest performance of gold prices.
Editor's Summary
The gold market is currently at a critical juncture in the battle between bulls and bears: geopolitical conflicts and the potential weakening of the US dollar provide long-term support, while expectations of a Fed rate cut and strong ETF inflows strengthen the buying base; however, crowded trade warnings and a short-term rebound in the US dollar pose resistance.
Overall, structural demand (such as central bank and institutional allocations) remains dominant, and the pullback may be a consolidation phase for higher levels rather than a trend reversal. Investors need to closely monitor developments in the Iranian situation, the US dollar index, and signals from the Federal Reserve to determine whether the safe-haven logic has restarted.
(Spot gold daily chart, source: FX678)
At 16:04 Beijing time, spot gold was trading at $4737.40 per ounce.
- Risk Warning and Disclaimer
- The market involves risk, and trading may not be suitable for all investors. This article is for reference only and does not constitute personal investment advice, nor does it take into account certain users’ specific investment objectives, financial situation, or other needs. Any investment decisions made based on this information are at your own risk.