Quadruple Witching Day coincides with Iranian shelling, plunging markets into "hell mode"! Which will break out first: crude oil, gold, US Treasury bonds, or the US dollar?
2026-03-20 20:07:52
On Friday (March 20), global financial markets were caught in the crossfire of extreme geopolitical uncertainty and expectations of a shift in monetary policy among major central banks. With the sudden escalation of the situation in the Middle East—particularly the Iranian attack on a Kuwaiti oil refinery and Israel's military action against targets in Tehran—concerns about energy supply disruptions have evolved into real panic. Meanwhile, the collective surge in yields on government bonds in major economies reflects a sharp repricing of the "prolonged high-interest-rate" environment in the market. Amid liquidity disruptions caused by the maturity of derivatives on "Quadruple Witching Day," risk aversion and tightening expectations intertwined, driving the oil, gold, and foreign exchange markets into a period of high volatility.
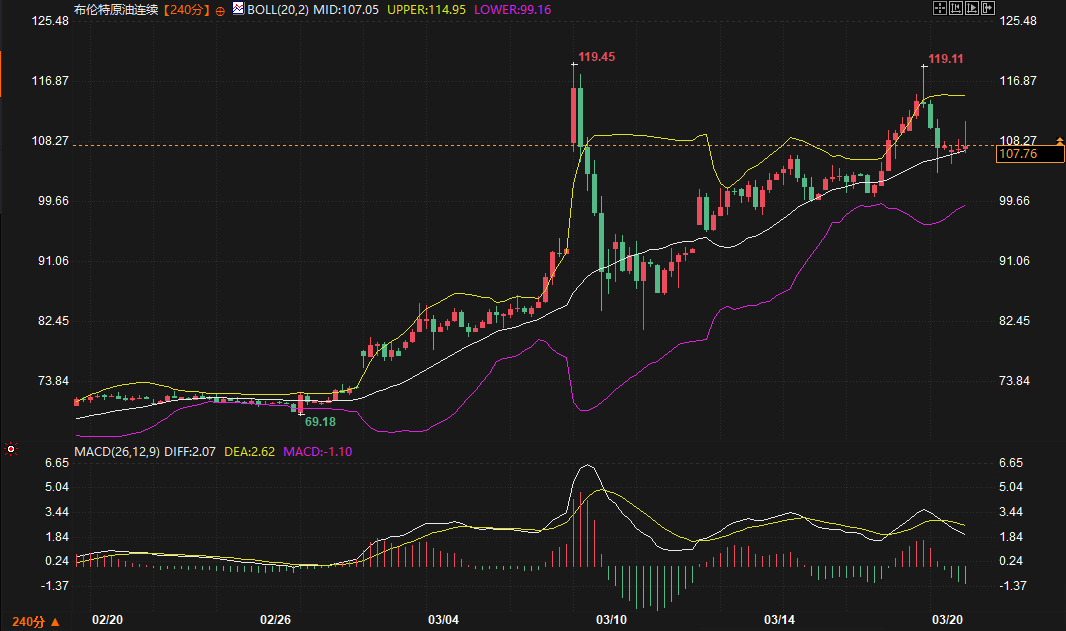
Driven directly by geopolitical tensions, Brent crude oil, after a period of unilateral price increases, is currently hovering around $ 107.76 . Fundamentally, the Strait of Hormuz, a vital chokepoint for 20% of global oil and liquefied natural gas transport, is facing a precarious security situation due to the escalating conflict between Iran and Israel. The attack on a Kuwaiti refinery has resulted in approximately 12% of the global demand gap remaining unfilled in the short term, and prominent institutions have even warned that if the conflict continues, oil prices could break through $ 180 by late April.
Technical analysis shows that Brent crude oil is currently in a short-term correction phase within a larger uptrend. On the 4-hour chart, the price is currently trading near the Bollinger Band middle line at 107.05 , which shows strong support. However, the MACD indicator shows the DIFF line crossing below the DEA line with continued expansion of the green bars, suggesting a short-term need for correction. In terms of candlestick patterns, the high of 119.45 in early March and the recent high of 119.11 have begun to form a double top pattern, making the upward pressure extremely heavy.
In the next 2-3 trading days, the key level to watch is the 107.05 middle Bollinger Band. If it stabilizes, the price may retest the 114.95 upper Bollinger Band; if it breaks down, the next support level will be the lower Bollinger Band at 99.16 . Amidst the interplay of anticipated extreme supply disruptions and technical adjustment pressures, crude oil prices are expected to remain highly volatile.
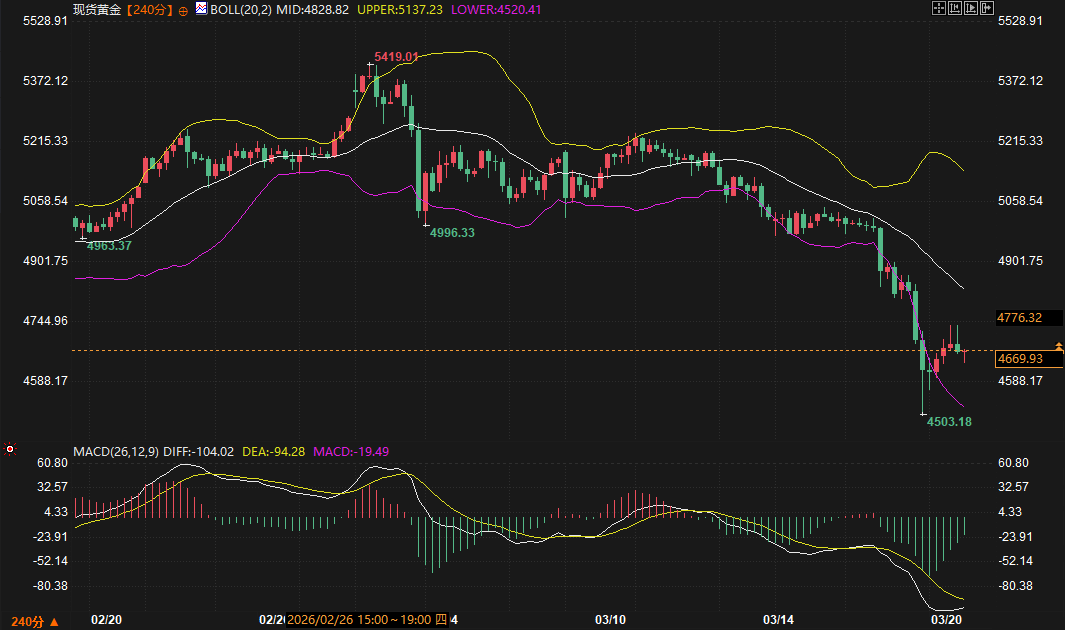
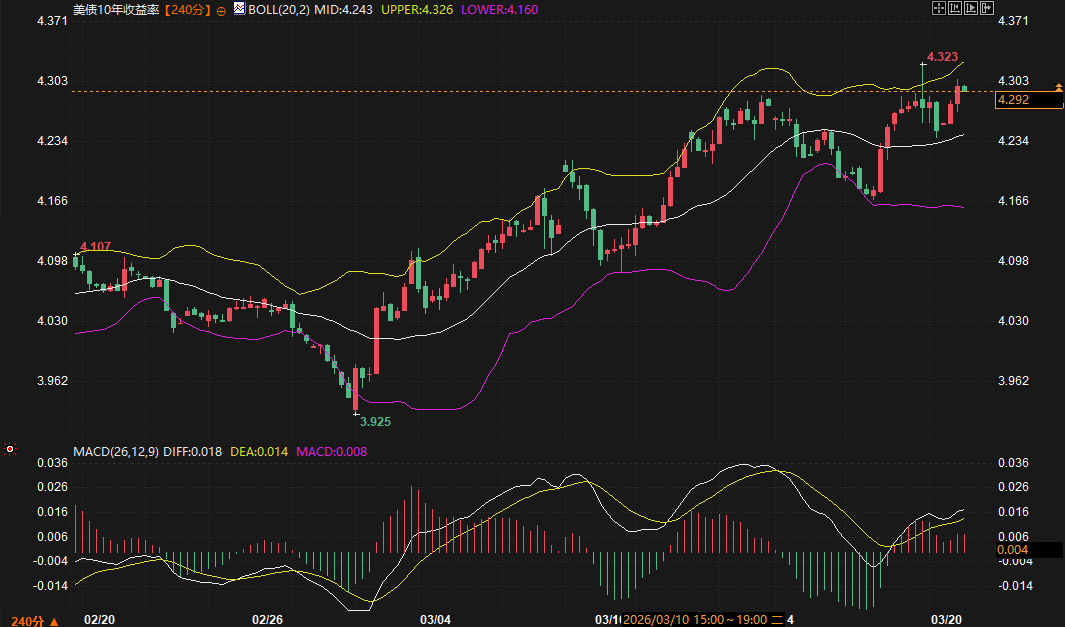
Unlike crude oil, which is supported by certain factors, spot gold has been extremely weak recently, currently priced at $ 4776.32 . While geopolitical tensions typically benefit safe-haven assets, the collective surge in global bond yields has dealt a fatal blow to gold, a non-interest-bearing asset. The yield on the 10-year US Treasury note has risen above 4.3% , and yields on UK and German bonds have also hit multi-year highs, significantly increasing the opportunity cost of holding gold.
From a technical analysis perspective, gold is in a clear downtrend. The 4-hour chart shows that although the price rebounded slightly after breaking below the lower Bollinger Band, it remains capped by the middle band at 4828.82 . While the MACD lines show signs of flattening out in the area significantly below the zero line, reflecting a weakening of bearish momentum and a potential for a technical oversold rebound, the overall weak trend remains unchanged.
In the short term, the strength of gold's recovery depends on whether it can break through the resistance level near 4828. If it fails to effectively recover this level, the price will likely continue to test the recent low of 4503 and the lower Bollinger Band support zone of 4520. Against the backdrop of a re-anchoring of global interest rate expectations, gold's "safe-haven attribute" is temporarily overshadowed by its "interest rate sensitivity."
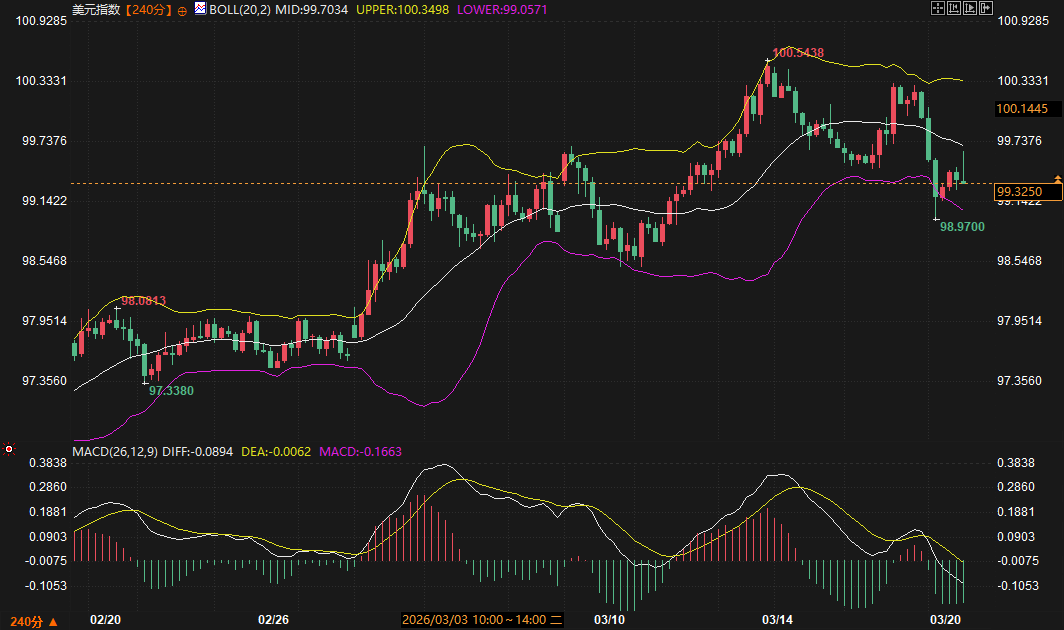
The US dollar index is currently trading around 99.3250 . Recent dollar movements have been primarily supported by rising US Treasury yields and cooling global risk appetite, but its internal structure has shown signs of divergence. Strong interest rate hike signals from the European Central Bank and the Bank of England amid inflationary pressures have put pressure on the dollar in cross-currency pairs, causing the dollar index to fluctuate and adjust at high levels.
From the 4-hour chart, the US dollar index broke below the Bollinger Band's middle band and found temporary support near the lower band at 99.05 . The MACD's death cross and the release of green momentum bars indicate a short-term correction phase, with the two lines converging towards the zero axis suggesting the trend is choosing a new direction. Currently, resistance is located in the middle band area of 99.70 , while key support lies between 98.50 and 99.05 .
Regarding US Treasuries, influenced by tariff rhetoric and inflation expectations driven by rising energy costs, the 2-year Treasury yield has risen to 3.875% . In the next 2-3 trading days, if the US dollar index can effectively hold the 99 level, its status as a safe-haven currency will remain strong in conjunction with the bond-buying effect; if it falls below the lower bound, it may trigger a deep correction towards 98.5 .
In summary, the market will enter a period of extremely high-frequency dynamic competition in the next 2-3 trading days. Crude oil is supported by empirical evidence of geopolitical supply, and even with technical adjustment pressures, its bottoming-out logic remains solid. Short-term focus should be on wide fluctuations within the 107-115 range. Gold, however, needs to be wary of a "second dip" after an oversold rebound; its upside potential is limited until expectations of peak interest rates stabilize. The correlation between the US dollar index and US Treasury yields will be a key indicator; if the dollar stabilizes above 99 , the rebound in commodities will be suppressed. Considering the option liquidation pressure brought by the "Quadruple Witching Day," investors are advised to pay close attention to liquidity risks and be wary of sudden market gaps caused by unexpected geopolitical news.
1. Why did gold prices fall sharply despite the deterioration of geopolitical tensions?
This is primarily attributed to the surge in holding costs. While geopolitical tensions have triggered safe-haven demand, the dominant market logic currently is the resurgence of global interest rate hike expectations due to rising inflation. Yields on US, UK, and German bonds have collectively soared, significantly diluting the attractiveness of gold as a non-interest-bearing asset compared to high-yield bonds. When "interest rate pressures" outweigh "safe-haven demand," gold prices experience a divergent decline.
2. Does the current "double top" pattern in Brent crude oil indicate the end of the upward trend?
Currently, this can only be viewed as a "short-term adjustment signal." Although the nascent double top pattern near $ 119 limits upside potential, the fundamental support for crude oil comes from disruptions in physical supply. As long as the risk of a blockade of the Strait of Hormuz remains, even if oil prices technically retrace to the lower trendline, the overall bullish logic remains largely intact.
3. Why has the recent trend of the US dollar index appeared more complex than that of US Treasury yields?
This is because currency pairs reflect relative value. While rising US Treasury yields support the dollar, recent hawkish statements from the German Chancellor and European officials have significantly increased interest rate expectations for the euro and pound. This "global austerity race" has partially offset the dollar's relative advantage, resulting in the dollar index exhibiting high-level fluctuations rather than a one-sided upward trend.
4. What is a "quadruple witching day," and what specific impact does it have on the market in the next two trading days?
"Quadruple witching day" refers to the day when stock options, index options, stock futures, and index futures all expire simultaneously. This typically leads to a sharp increase in trading volume and disorderly market fluctuations. Given the current high geopolitical risks, derivatives liquidation and hedging activities may amplify the volatility of crude oil and gold, causing irrational, sudden price spikes or pullbacks.
5. If the US dollar falls below the 99 mark, what kind of chain reaction will it have on commodities?
Since commodities are priced in US dollars, a weaker dollar typically provides direct support for oil and gold prices from an exchange rate perspective. If the dollar breaks below key support levels, it will alleviate the current pressure on gold due to excessively high US Treasury yields, potentially turning gold's "oversold correction" into a strong rebound and helping oil break out of its current consolidation range.
Crude Oil: High-level consolidation and double-top resistance amid supply disruption concerns
Driven directly by geopolitical tensions, Brent crude oil, after a period of unilateral price increases, is currently hovering around $ 107.76 . Fundamentally, the Strait of Hormuz, a vital chokepoint for 20% of global oil and liquefied natural gas transport, is facing a precarious security situation due to the escalating conflict between Iran and Israel. The attack on a Kuwaiti refinery has resulted in approximately 12% of the global demand gap remaining unfilled in the short term, and prominent institutions have even warned that if the conflict continues, oil prices could break through $ 180 by late April.
Technical analysis shows that Brent crude oil is currently in a short-term correction phase within a larger uptrend. On the 4-hour chart, the price is currently trading near the Bollinger Band middle line at 107.05 , which shows strong support. However, the MACD indicator shows the DIFF line crossing below the DEA line with continued expansion of the green bars, suggesting a short-term need for correction. In terms of candlestick patterns, the high of 119.45 in early March and the recent high of 119.11 have begun to form a double top pattern, making the upward pressure extremely heavy.
In the next 2-3 trading days, the key level to watch is the 107.05 middle Bollinger Band. If it stabilizes, the price may retest the 114.95 upper Bollinger Band; if it breaks down, the next support level will be the lower Bollinger Band at 99.16 . Amidst the interplay of anticipated extreme supply disruptions and technical adjustment pressures, crude oil prices are expected to remain highly volatile.
Spot Gold: The Logic of Oversold Correction Amidst a Dominant Downtrend
Unlike crude oil, which is supported by certain factors, spot gold has been extremely weak recently, currently priced at $ 4776.32 . While geopolitical tensions typically benefit safe-haven assets, the collective surge in global bond yields has dealt a fatal blow to gold, a non-interest-bearing asset. The yield on the 10-year US Treasury note has risen above 4.3% , and yields on UK and German bonds have also hit multi-year highs, significantly increasing the opportunity cost of holding gold.
From a technical analysis perspective, gold is in a clear downtrend. The 4-hour chart shows that although the price rebounded slightly after breaking below the lower Bollinger Band, it remains capped by the middle band at 4828.82 . While the MACD lines show signs of flattening out in the area significantly below the zero line, reflecting a weakening of bearish momentum and a potential for a technical oversold rebound, the overall weak trend remains unchanged.
In the short term, the strength of gold's recovery depends on whether it can break through the resistance level near 4828. If it fails to effectively recover this level, the price will likely continue to test the recent low of 4503 and the lower Bollinger Band support zone of 4520. Against the backdrop of a re-anchoring of global interest rate expectations, gold's "safe-haven attribute" is temporarily overshadowed by its "interest rate sensitivity."
US Dollar and US Treasuries: High-Level Game Driven by Renewed Tightening Expectations
The US dollar index is currently trading around 99.3250 . Recent dollar movements have been primarily supported by rising US Treasury yields and cooling global risk appetite, but its internal structure has shown signs of divergence. Strong interest rate hike signals from the European Central Bank and the Bank of England amid inflationary pressures have put pressure on the dollar in cross-currency pairs, causing the dollar index to fluctuate and adjust at high levels.
From the 4-hour chart, the US dollar index broke below the Bollinger Band's middle band and found temporary support near the lower band at 99.05 . The MACD's death cross and the release of green momentum bars indicate a short-term correction phase, with the two lines converging towards the zero axis suggesting the trend is choosing a new direction. Currently, resistance is located in the middle band area of 99.70 , while key support lies between 98.50 and 99.05 .
Regarding US Treasuries, influenced by tariff rhetoric and inflation expectations driven by rising energy costs, the 2-year Treasury yield has risen to 3.875% . In the next 2-3 trading days, if the US dollar index can effectively hold the 99 level, its status as a safe-haven currency will remain strong in conjunction with the bond-buying effect; if it falls below the lower bound, it may trigger a deep correction towards 98.5 .
Future Outlook
In summary, the market will enter a period of extremely high-frequency dynamic competition in the next 2-3 trading days. Crude oil is supported by empirical evidence of geopolitical supply, and even with technical adjustment pressures, its bottoming-out logic remains solid. Short-term focus should be on wide fluctuations within the 107-115 range. Gold, however, needs to be wary of a "second dip" after an oversold rebound; its upside potential is limited until expectations of peak interest rates stabilize. The correlation between the US dollar index and US Treasury yields will be a key indicator; if the dollar stabilizes above 99 , the rebound in commodities will be suppressed. Considering the option liquidation pressure brought by the "Quadruple Witching Day," investors are advised to pay close attention to liquidity risks and be wary of sudden market gaps caused by unexpected geopolitical news.
Frequently Asked Questions
1. Why did gold prices fall sharply despite the deterioration of geopolitical tensions?
This is primarily attributed to the surge in holding costs. While geopolitical tensions have triggered safe-haven demand, the dominant market logic currently is the resurgence of global interest rate hike expectations due to rising inflation. Yields on US, UK, and German bonds have collectively soared, significantly diluting the attractiveness of gold as a non-interest-bearing asset compared to high-yield bonds. When "interest rate pressures" outweigh "safe-haven demand," gold prices experience a divergent decline.
2. Does the current "double top" pattern in Brent crude oil indicate the end of the upward trend?
Currently, this can only be viewed as a "short-term adjustment signal." Although the nascent double top pattern near $ 119 limits upside potential, the fundamental support for crude oil comes from disruptions in physical supply. As long as the risk of a blockade of the Strait of Hormuz remains, even if oil prices technically retrace to the lower trendline, the overall bullish logic remains largely intact.
3. Why has the recent trend of the US dollar index appeared more complex than that of US Treasury yields?
This is because currency pairs reflect relative value. While rising US Treasury yields support the dollar, recent hawkish statements from the German Chancellor and European officials have significantly increased interest rate expectations for the euro and pound. This "global austerity race" has partially offset the dollar's relative advantage, resulting in the dollar index exhibiting high-level fluctuations rather than a one-sided upward trend.
4. What is a "quadruple witching day," and what specific impact does it have on the market in the next two trading days?
"Quadruple witching day" refers to the day when stock options, index options, stock futures, and index futures all expire simultaneously. This typically leads to a sharp increase in trading volume and disorderly market fluctuations. Given the current high geopolitical risks, derivatives liquidation and hedging activities may amplify the volatility of crude oil and gold, causing irrational, sudden price spikes or pullbacks.
5. If the US dollar falls below the 99 mark, what kind of chain reaction will it have on commodities?
Since commodities are priced in US dollars, a weaker dollar typically provides direct support for oil and gold prices from an exchange rate perspective. If the dollar breaks below key support levels, it will alleviate the current pressure on gold due to excessively high US Treasury yields, potentially turning gold's "oversold correction" into a strong rebound and helping oil break out of its current consolidation range.
- Risk Warning and Disclaimer
- The market involves risk, and trading may not be suitable for all investors. This article is for reference only and does not constitute personal investment advice, nor does it take into account certain users’ specific investment objectives, financial situation, or other needs. Any investment decisions made based on this information are at your own risk.