Gold prices plunged more than 8% intraday to a four-month low, testing the $4,000 mark.
2026-03-23 19:43:01
On Monday (March 23), during the European session, spot gold prices began to decline from around 4530, influenced by continued tensions in the Middle East fueling inflation concerns and market expectations that global interest rates would remain high. The price briefly plunged to around 4135, a drop of nearly 9%, hitting a four-month low. Prices subsequently recovered gradually, rebounding to around 4423, recovering approximately $300 from the intraday low, but still below the opening price.

Gold has broken below its medium-term uptrend line, falling for the ninth consecutive trading day and breaching the year-to-date low of $4,400 reached on January 2nd, hitting its lowest level since November 11, 2025. Last week alone, gold fell by more than 10.5%.
Momentum indicators confirm a clear bearish trend for gold. The Stochastic Oscillator and Relative Strength Index (RSI) are flat and firmly in oversold territory, reflecting continued downward pressure; the Moving Average Convergence Divergence (MACD) continues to decline in negative territory, highlighting the strength of this sell-off.
The 200-day simple moving average (SMA) around 4090 is currently a key support level. A decisive break below this level would further strengthen the bearish trend, targeting the psychological level of 4000. After breaking below this level, the lows of September and October 2025 at 3880, 3720, and 3620 would become the next downside targets.
On the upside, gold prices have broken through the 4300-4400 range; if gold prices continue to rebound, they may test the previous support level – the upward trend line near 4650.
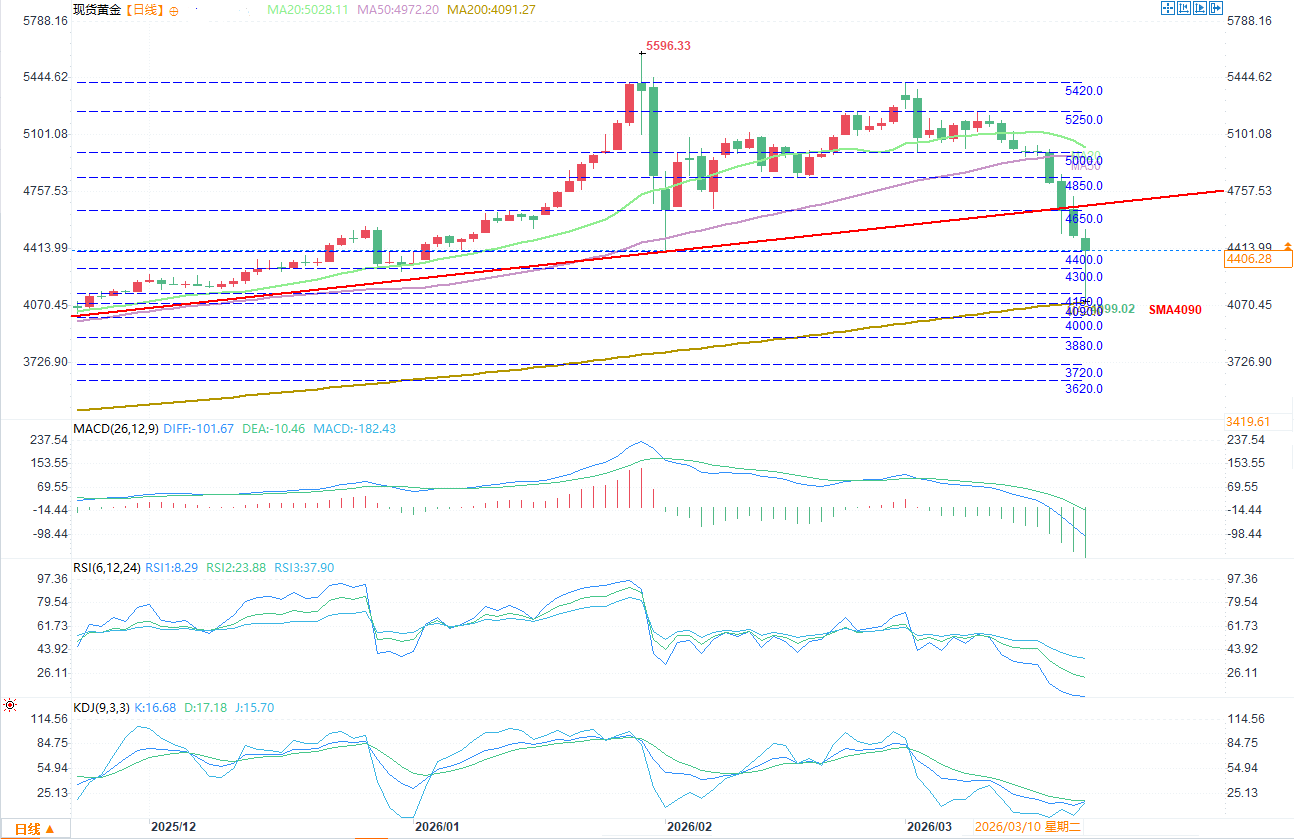
(Spot gold daily chart source: FX678)
In summary, the downtrend in gold remains solid, with a drop of over 21.5% this month, erasing all gains made so far this year. As long as gold prices remain below the broken uptrend line, especially if they break below the 200-day moving average, any current rebound is likely to be limited and could easily be met with another round of selling.
At 19:38 Beijing time, spot gold was trading at $4408.55 per ounce, down 1.97%.
Gold has broken below its medium-term uptrend line, falling for the ninth consecutive trading day and breaching the year-to-date low of $4,400 reached on January 2nd, hitting its lowest level since November 11, 2025. Last week alone, gold fell by more than 10.5%.
Momentum indicators confirm a clear bearish trend for gold. The Stochastic Oscillator and Relative Strength Index (RSI) are flat and firmly in oversold territory, reflecting continued downward pressure; the Moving Average Convergence Divergence (MACD) continues to decline in negative territory, highlighting the strength of this sell-off.
The 200-day simple moving average (SMA) around 4090 is currently a key support level. A decisive break below this level would further strengthen the bearish trend, targeting the psychological level of 4000. After breaking below this level, the lows of September and October 2025 at 3880, 3720, and 3620 would become the next downside targets.
On the upside, gold prices have broken through the 4300-4400 range; if gold prices continue to rebound, they may test the previous support level – the upward trend line near 4650.
(Spot gold daily chart source: FX678)
In summary, the downtrend in gold remains solid, with a drop of over 21.5% this month, erasing all gains made so far this year. As long as gold prices remain below the broken uptrend line, especially if they break below the 200-day moving average, any current rebound is likely to be limited and could easily be met with another round of selling.
At 19:38 Beijing time, spot gold was trading at $4408.55 per ounce, down 1.97%.
- Risk Warning and Disclaimer
- The market involves risk, and trading may not be suitable for all investors. This article is for reference only and does not constitute personal investment advice, nor does it take into account certain users’ specific investment objectives, financial situation, or other needs. Any investment decisions made based on this information are at your own risk.