Gold prices fell to a new low for 2026 during the session.
2026-03-23 20:16:28
As can be seen from the gold/dollar chart, at the start of this week, gold prices fell below the $4,150 mark, hitting a new low for 2026. The last time gold prices were at this level was in early December 2025—before the upward trend that challenged historical highs had begun.
Why are gold prices continuing to fall?
Multiple factors are putting downward pressure on gold prices, including:
The market expects the Federal Reserve to maintain high interest rates for an extended period.
High oil prices have increased the risk of inflation.
In such a market environment, investors may shift their funds towards bond assets. Compared to gold, which does not generate returns, bonds become significantly more attractive.
Technical Analysis
On the morning of March 16th, we identified that gold prices were forming consecutive lower highs and lower lows (pattern marking: A–B–C–D–E). In addition:
The key technical support level has been broken;
A downward channel pattern has clearly formed;
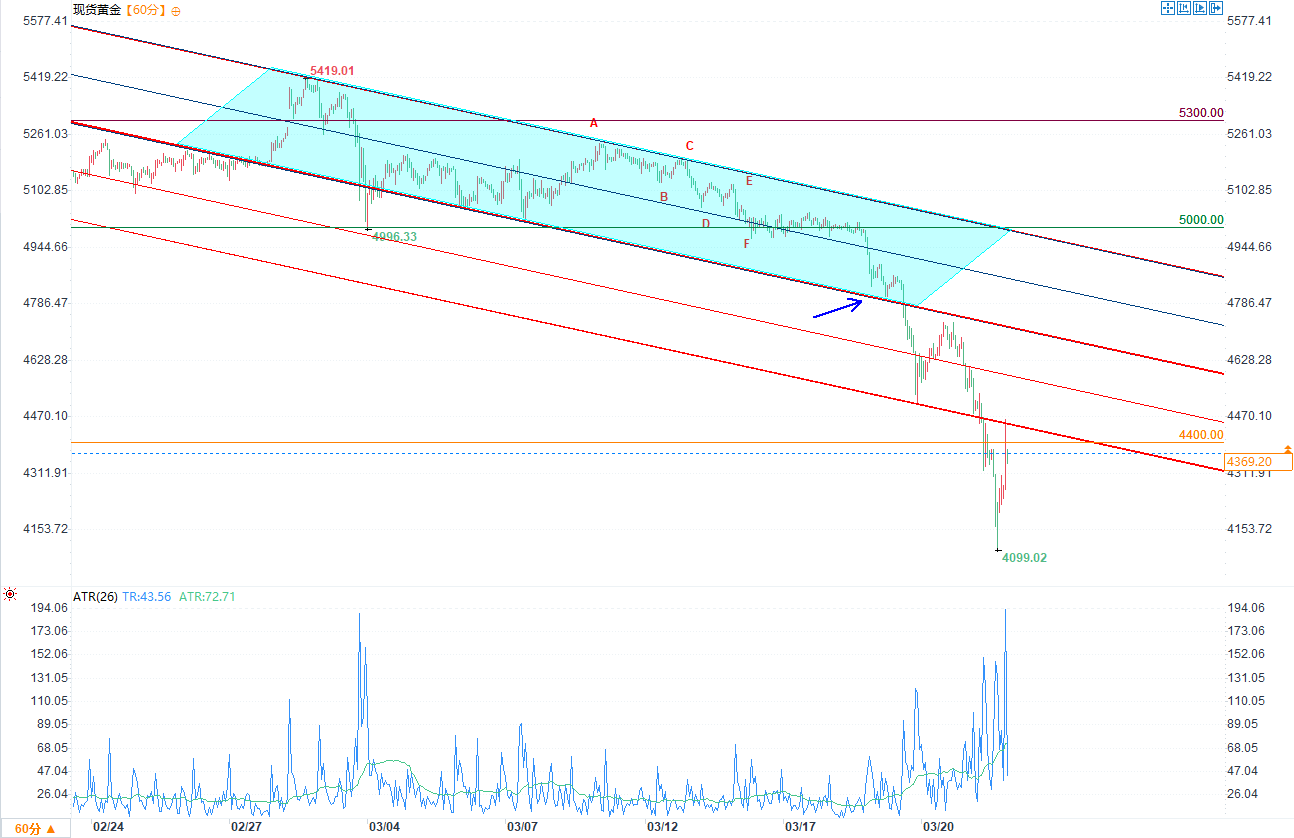
(Spot gold 1-hour chart source: EasyForex)
Our assessment at the time was that if the bears continued to control the market, the gold price would move towards the lower boundary of the channel.
As seen in the gold/dollar chart, bearish momentum re-emerged on March 18th. Gold prices not only fell to the lower channel line (as indicated by the arrow in the chart), but also broke through it, providing evidence for the extension of the descending channel. However, the extended lower channel line has currently withstood selling pressure and has not yet been further breached.
The current market situation is extremely severe:
Since its March high, gold prices have fallen by about 25%.
Media reports indicate that gold prices recorded their worst weekly performance since 1983 this week.
Almost all oscillators indicate that gold prices are severely oversold;
The Average True Range (ATR) indicator has surged to extremely high levels, which may indicate that a chain of liquidations is taking place among long positions.
Against this backdrop, traders need to be wary of sharp fluctuations in gold prices in order to manage risk more effectively. The possibility of a slowdown in the decline of gold prices cannot be ruled out, supported by factors including:
Support at the psychological level of $4,000;
The geopolitical situation remains tense, with the ongoing conflict in the Middle East being the core driving force.
Why are gold prices continuing to fall?
Multiple factors are putting downward pressure on gold prices, including:
The market expects the Federal Reserve to maintain high interest rates for an extended period.
High oil prices have increased the risk of inflation.
In such a market environment, investors may shift their funds towards bond assets. Compared to gold, which does not generate returns, bonds become significantly more attractive.
Technical Analysis
On the morning of March 16th, we identified that gold prices were forming consecutive lower highs and lower lows (pattern marking: A–B–C–D–E). In addition:
The key technical support level has been broken;
A downward channel pattern has clearly formed;
(Spot gold 1-hour chart source: EasyForex)
Our assessment at the time was that if the bears continued to control the market, the gold price would move towards the lower boundary of the channel.
As seen in the gold/dollar chart, bearish momentum re-emerged on March 18th. Gold prices not only fell to the lower channel line (as indicated by the arrow in the chart), but also broke through it, providing evidence for the extension of the descending channel. However, the extended lower channel line has currently withstood selling pressure and has not yet been further breached.
The current market situation is extremely severe:
Since its March high, gold prices have fallen by about 25%.
Media reports indicate that gold prices recorded their worst weekly performance since 1983 this week.
Almost all oscillators indicate that gold prices are severely oversold;
The Average True Range (ATR) indicator has surged to extremely high levels, which may indicate that a chain of liquidations is taking place among long positions.
Against this backdrop, traders need to be wary of sharp fluctuations in gold prices in order to manage risk more effectively. The possibility of a slowdown in the decline of gold prices cannot be ruled out, supported by factors including:
Support at the psychological level of $4,000;
The geopolitical situation remains tense, with the ongoing conflict in the Middle East being the core driving force.
- Risk Warning and Disclaimer
- The market involves risk, and trading may not be suitable for all investors. This article is for reference only and does not constitute personal investment advice, nor does it take into account certain users’ specific investment objectives, financial situation, or other needs. Any investment decisions made based on this information are at your own risk.