Geopolitical tensions abruptly ceased, yet US Treasury yields plummeted from their highs? Is the market racing to predict a script no one has explicitly stated?
2026-03-23 21:20:36
On Monday (March 23), the US Treasury market experienced dramatic volatility amidst global financial market turmoil. The benchmark 10-year US Treasury yield fell significantly from an eight-month high due to a sudden reversal in the Middle East situation. Previously, market concerns about escalating geopolitical risks had pushed the yield to a peak range of 4.442% to 4.445% , but the latest news indicating that the planned strikes against Iranian energy infrastructure had been suspended due to progress in dialogue led to a simultaneous easing of safe-haven premiums and inflation concerns.

As of press time, the 10-year US Treasury yield was 4.367% , showing a clear pattern of rising and then falling during the day. Meanwhile, short-term yields also exhibited similar volatile movements; the 2-year US Treasury yield , after reaching a high of 4.016% , briefly dipped to 3.805% , before fluctuating around 3.911% . This sharp market volatility reflects traders' search for a new balance between pressing Middle East diplomatic developments and robust inflation expectations.
From a macro perspective, today's market turning point stemmed from a sharp drop in geopolitical pressure. Earlier, tensions in Iran triggered market panic regarding potential disruptions to the energy supply chain and soaring oil prices, a logic that directly translated into inflation expectations, thus pushing up US Treasury yields. However, with the US announcing a five-day ceasefire following productive dialogue, downward pressure on oil prices conversely suppressed long-term inflation compensation in the bond market.
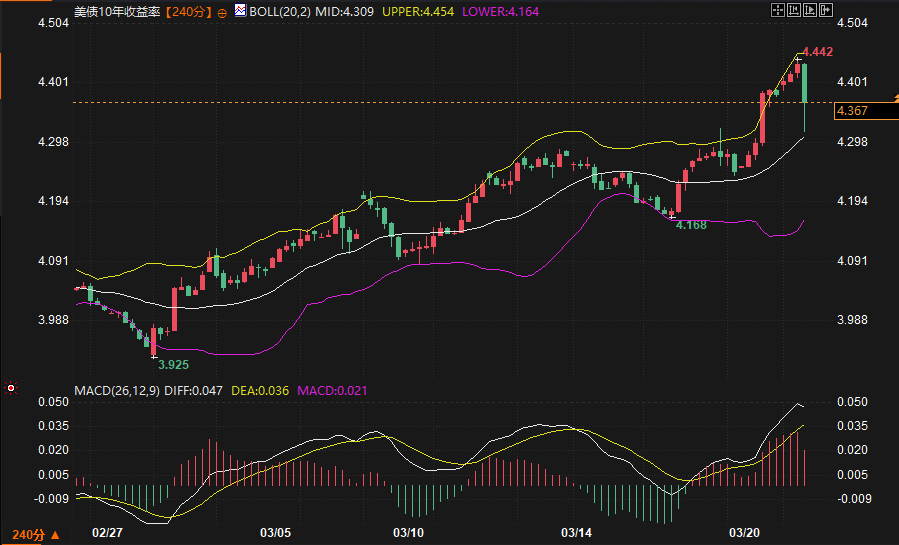
This rapid shift in sentiment is clearly evidenced on the 240-minute technical chart . Since the low of 3.925% in late February, US Treasury yields have been in a standard upward channel. The morning's surge followed by a pullback resulted in a large bearish candlestick with a long upper shadow, which is technically considered a strong signal of a short-term top.
Detailed breakdown of indicators:
1. Bollinger Bands (BOLL) : The yield previously broke through the upper band at 4.454% , indicating an extremely overbought condition. The current rapid pullback has brought the price back into the channel and is attempting to test the support strength of the middle band at 4.309% . If this level is broken, the upward trend will be considered to have ended for the time being.
2. MACD Indicator : Although the DIF and DEA are still in positive territory (0.047/0.036) and the red bars still exist, the trend of the bars shortening is obvious. Considering that the price is fluctuating at a high level while the MACD has failed to reach a new high in sync, a hidden top divergence has appeared in the technical picture, indicating that the medium-term momentum is waning.
This easing of yields from their high levels had a ripple effect on other markets. As yields fell from their peaks, the dollar index's upward momentum was hampered, indirectly providing a floor for safe-haven assets such as gold. In the stock market, the decline in yields eased discount rate pressures, but investors remained wary of potential trade protectionism triggered by future tariff rhetoric and uncertainties surrounding the Middle East situation.
Support and resistance range prediction:
Reference Contract : 10-Year US Treasury Yield (US10YT=RR)
Pressure range : 4.442% - 4.454% (the heavy pressure zone formed by the recent peak and the upper Bollinger Band).
Support range : 4.305% - 4.309% (the confluence of today's low and the Bollinger Band middle line).
Range logic : If the market can hold steady above the middle band, it may maintain a high-level sideways movement; once it effectively breaks below the 4.30% level, the pullback target will be around 4.16% .
Key points to watch during the trading session : Tonight, the U.S. Treasury will auction a total of $166 billion in short-term notes. Attention should be paid to the market's absorption capacity and the subsequent construction spending data as evidence of economic strength.
In the short term, the US Treasury market has entered a period of high volatility and observation, driven by geopolitical news. Although the easing of tensions in Iran has alleviated immediate selling pressure, fundamentals remain resilient: the prevailing market view has begun to factor in the possibility of further interest rate hikes by the Federal Reserve, which sharply contradicts the previously widespread expectation of rate cuts.
From a technical perspective, as long as the previous low support level of 4.168% remains intact, the long-term ascending flag pattern remains valid. In the coming trading days, the key focus will be on the diplomatic outcome after the five-day ceasefire ends. If the situation reverts to previous volatility, a second test of the 4.45% resistance level is possible; conversely, if a substantial diplomatic breakthrough is achieved, and inflation data returns to normal, yields are expected to return to a more rational range below 4.20% .
Q: Why did the easing of tensions in Iran lead to a drop in US Treasury yields?
A: Bond yields and bond prices move inversely. When signs of easing tensions in Iran emerge, market concerns about inflation caused by soaring energy prices decrease. Lower inflation expectations mean investors don't need extremely high yields to compensate for future purchasing power losses, thus bonds receive buying support, prices rebound, and yields correspondingly fall from their highs.
Q: How should we understand the "top divergence" phenomenon on the 240-minute chart of US Treasury bonds?
A: Top divergence occurs when the price (in this case, the yield) reaches a new high (e.g., 4.445% ), while technical indicators (e.g., the MACD histogram) fail to reach a new high simultaneously, instead leveling off or declining. This reflects weakening upward momentum, indicating that buying power cannot sustain its strength at high levels. It is a typical signal of trend momentum exhaustion, suggesting a risk of a short-term pullback.
Q: What is the underlying logic behind the market's talk of a possible interest rate hike?
A: According to the latest interest rate futures data, the market has begun to price in the possibility of an interest rate hike this year. This shift is mainly due to the stronger-than-expected resilience of the US economy and the recent cautious statements from Federal Reserve officials regarding the pace of inflation decline. If economic data remains strong and the risk of double-dip inflation rises due to factors such as tariff rhetoric , monetary policy may be forced to shift from "maintaining" to "tightening".
Q: What would it mean if the 10-year US Treasury yield fell below the midpoint of 4.309%?
A: In technical analysis, the Bollinger Band middle line is a watershed between bullish and bearish strength. If the 10-year US Treasury yield effectively falls below 4.309% , it means that the strong upward trend since February has been broken, and the market will shift from a one-sided upward trend to a downward trend or range-bound consolidation. The downside potential will open directly to the previous low near 4.168% , which is usually accompanied by a readjustment of market risk appetite.
Q: What potential impact will today's large-scale U.S. Treasury auction have on yields?
A: The Treasury Department auctioned $166 billion in medium- and short-term notes today. If the auction results show a low bid-to-cover ratio, it indicates weak demand for US Treasuries, and yields may be forced to rise again to attract buyers. Conversely, if market demand is strong, it will further solidify the judgment that yields have peaked and are correcting.
As of press time, the 10-year US Treasury yield was 4.367% , showing a clear pattern of rising and then falling during the day. Meanwhile, short-term yields also exhibited similar volatile movements; the 2-year US Treasury yield , after reaching a high of 4.016% , briefly dipped to 3.805% , before fluctuating around 3.911% . This sharp market volatility reflects traders' search for a new balance between pressing Middle East diplomatic developments and robust inflation expectations.
Fundamental logic analysis and technical bull-bear game
From a macro perspective, today's market turning point stemmed from a sharp drop in geopolitical pressure. Earlier, tensions in Iran triggered market panic regarding potential disruptions to the energy supply chain and soaring oil prices, a logic that directly translated into inflation expectations, thus pushing up US Treasury yields. However, with the US announcing a five-day ceasefire following productive dialogue, downward pressure on oil prices conversely suppressed long-term inflation compensation in the bond market.
This rapid shift in sentiment is clearly evidenced on the 240-minute technical chart . Since the low of 3.925% in late February, US Treasury yields have been in a standard upward channel. The morning's surge followed by a pullback resulted in a large bearish candlestick with a long upper shadow, which is technically considered a strong signal of a short-term top.
Detailed breakdown of indicators:
1. Bollinger Bands (BOLL) : The yield previously broke through the upper band at 4.454% , indicating an extremely overbought condition. The current rapid pullback has brought the price back into the channel and is attempting to test the support strength of the middle band at 4.309% . If this level is broken, the upward trend will be considered to have ended for the time being.
2. MACD Indicator : Although the DIF and DEA are still in positive territory (0.047/0.036) and the red bars still exist, the trend of the bars shortening is obvious. Considering that the price is fluctuating at a high level while the MACD has failed to reach a new high in sync, a hidden top divergence has appeared in the technical picture, indicating that the medium-term momentum is waning.
This easing of yields from their high levels had a ripple effect on other markets. As yields fell from their peaks, the dollar index's upward momentum was hampered, indirectly providing a floor for safe-haven assets such as gold. In the stock market, the decline in yields eased discount rate pressures, but investors remained wary of potential trade protectionism triggered by future tariff rhetoric and uncertainties surrounding the Middle East situation.
Support and resistance range prediction:
Reference Contract : 10-Year US Treasury Yield (US10YT=RR)
Pressure range : 4.442% - 4.454% (the heavy pressure zone formed by the recent peak and the upper Bollinger Band).
Support range : 4.305% - 4.309% (the confluence of today's low and the Bollinger Band middle line).
Range logic : If the market can hold steady above the middle band, it may maintain a high-level sideways movement; once it effectively breaks below the 4.30% level, the pullback target will be around 4.16% .
Key points to watch during the trading session : Tonight, the U.S. Treasury will auction a total of $166 billion in short-term notes. Attention should be paid to the market's absorption capacity and the subsequent construction spending data as evidence of economic strength.
Future Trend Outlook
In the short term, the US Treasury market has entered a period of high volatility and observation, driven by geopolitical news. Although the easing of tensions in Iran has alleviated immediate selling pressure, fundamentals remain resilient: the prevailing market view has begun to factor in the possibility of further interest rate hikes by the Federal Reserve, which sharply contradicts the previously widespread expectation of rate cuts.
From a technical perspective, as long as the previous low support level of 4.168% remains intact, the long-term ascending flag pattern remains valid. In the coming trading days, the key focus will be on the diplomatic outcome after the five-day ceasefire ends. If the situation reverts to previous volatility, a second test of the 4.45% resistance level is possible; conversely, if a substantial diplomatic breakthrough is achieved, and inflation data returns to normal, yields are expected to return to a more rational range below 4.20% .
Frequently Asked Questions
Q: Why did the easing of tensions in Iran lead to a drop in US Treasury yields?
A: Bond yields and bond prices move inversely. When signs of easing tensions in Iran emerge, market concerns about inflation caused by soaring energy prices decrease. Lower inflation expectations mean investors don't need extremely high yields to compensate for future purchasing power losses, thus bonds receive buying support, prices rebound, and yields correspondingly fall from their highs.
Q: How should we understand the "top divergence" phenomenon on the 240-minute chart of US Treasury bonds?
A: Top divergence occurs when the price (in this case, the yield) reaches a new high (e.g., 4.445% ), while technical indicators (e.g., the MACD histogram) fail to reach a new high simultaneously, instead leveling off or declining. This reflects weakening upward momentum, indicating that buying power cannot sustain its strength at high levels. It is a typical signal of trend momentum exhaustion, suggesting a risk of a short-term pullback.
Q: What is the underlying logic behind the market's talk of a possible interest rate hike?
A: According to the latest interest rate futures data, the market has begun to price in the possibility of an interest rate hike this year. This shift is mainly due to the stronger-than-expected resilience of the US economy and the recent cautious statements from Federal Reserve officials regarding the pace of inflation decline. If economic data remains strong and the risk of double-dip inflation rises due to factors such as tariff rhetoric , monetary policy may be forced to shift from "maintaining" to "tightening".
Q: What would it mean if the 10-year US Treasury yield fell below the midpoint of 4.309%?
A: In technical analysis, the Bollinger Band middle line is a watershed between bullish and bearish strength. If the 10-year US Treasury yield effectively falls below 4.309% , it means that the strong upward trend since February has been broken, and the market will shift from a one-sided upward trend to a downward trend or range-bound consolidation. The downside potential will open directly to the previous low near 4.168% , which is usually accompanied by a readjustment of market risk appetite.
Q: What potential impact will today's large-scale U.S. Treasury auction have on yields?
A: The Treasury Department auctioned $166 billion in medium- and short-term notes today. If the auction results show a low bid-to-cover ratio, it indicates weak demand for US Treasuries, and yields may be forced to rise again to attract buyers. Conversely, if market demand is strong, it will further solidify the judgment that yields have peaked and are correcting.
- Risk Warning and Disclaimer
- The market involves risk, and trading may not be suitable for all investors. This article is for reference only and does not constitute personal investment advice, nor does it take into account certain users’ specific investment objectives, financial situation, or other needs. Any investment decisions made based on this information are at your own risk.