Has the top of the gold bull market been confirmed?
2026-03-24 20:16:23
Has the peak of the gold bull market been confirmed? Since March 2026, international gold prices have fallen rapidly from their highs at the beginning of the year, currently hovering in the $4,300-$4,400/ounce range, a cumulative drop of over 18%-22% from the January peak (approximately $5,300-$5,500). This sharp decline is not accidental, but the result of multiple converging signals: a confirmed double-top technical pattern, continued large-scale ETF selling, an overestimation of the logic behind central bank gold purchases, and most importantly—a hawkish outlook has arrived. The Federal Reserve has turned hawkish due to the surge in oil prices triggered by the conflict with Iran, raising inflation expectations and significantly narrowing the path of interest rate cuts. The dual pressure of a strong dollar and high yields directly signals that the short-term top for gold has arrived.

Technical analysis has issued the first warning of a top: the double-top pattern is now fully confirmed.
Gold prices retreated after two precise tops near $5336, breaking below the neckline (key support around $4400-$4000), forming a classic "M" double-top pattern. The MACD has formed a death cross, the RSI has fallen from overbought levels, and short-term moving averages are in a bearish alignment, with volume and price relationships indicating significantly increased selling pressure at the highs. The downside path has become the "path of least resistance," with a measured target of the $3600-$4000 range. This is not a short-term fluctuation, but rather a confirmation signal of profit-taking at high levels and a trend reversal.
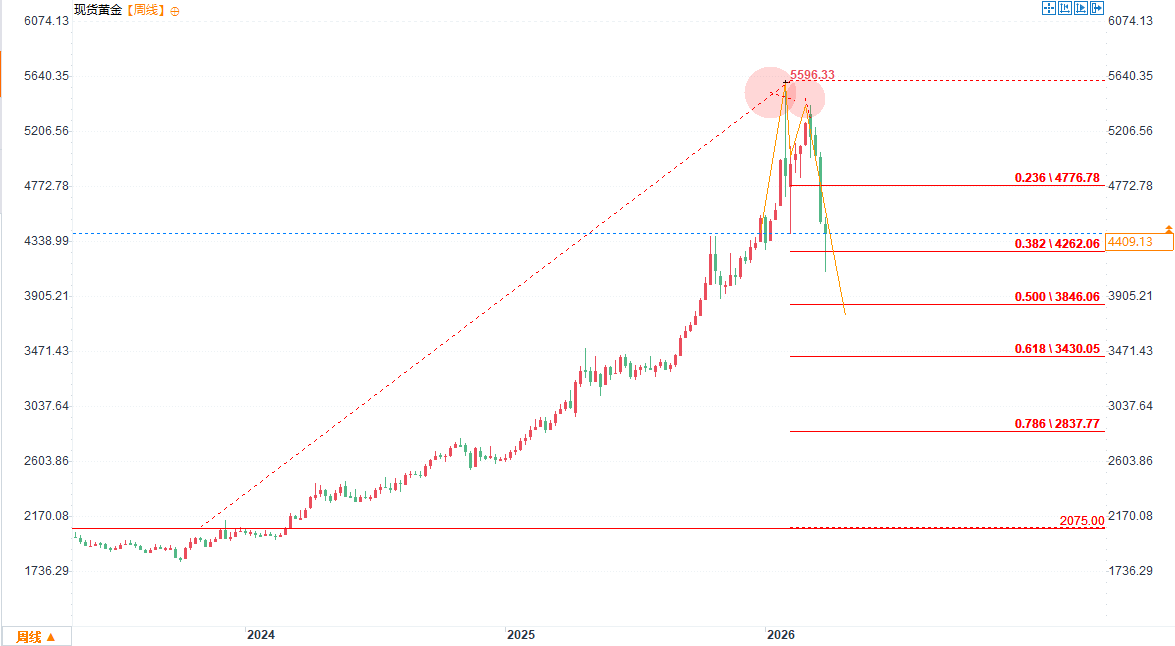
(Spot gold weekly chart source: FX678)
Institutions have explicitly warned against overestimating the supporting role of central bank gold purchases.
A recent research report from China International Capital Corporation (CICC) bluntly states that "the motivation of global central banks to purchase gold should not be overestimated." Although emerging market central banks are still strategically increasing their holdings, developed countries are showing little interest, and central bank gold purchases are a long-term, slow-moving activity with very low sensitivity to short-term prices.
In fact, some central banks have already been selling gold. In January 2026, Russia became the largest net seller (selling 9 tons), the National Bank of Bulgaria sold 2 tons due to the euro's accession to the euro, and Kazakhstan and Kyrgyzstan each reduced their holdings by 1 ton. When gold prices rise too quickly, downward pressure is inevitable. Ordinary investors (especially ETF holders) are far more prone to "buying high and selling low" than central banks, a logic that has been fully validated in the current high-level fluctuations.
ETF outflows intensify: High-level selling becomes a reality
Holdings in the world's largest gold ETF, SPDR Gold Trust (GLD), have plummeted from over 1,070 tons in early March to 1,056.99 tons (as of March 20th), marking several consecutive days of net selling. March saw the largest outflow in 13 years, with cumulative outflows exceeding $6 billion over the past three weeks. North America led the outflows, while Europe also recorded net redemptions at times. The forced liquidation of leveraged positions and profit-taking have created a vicious cycle, further amplifying downward pressure on prices.
Gold's "strange" failure during the Iranian conflict: The safe-haven logic has been completely overturned.
Nearly a month after the outbreak of the Middle East conflict, gold prices not only failed to rise but instead plummeted by over 18% after an initial surge. The core reason for the failure of the traditional safe-haven logic lies in the fact that oil prices surged to over $100-102 per barrel due to the risk in the Strait of Hormuz, pushing up global inflation expectations and forcing the Federal Reserve to tighten policy. Safe-haven demand was completely overshadowed by the chain reaction of "oil prices → inflation → hawkish Fed → strong dollar," leading to profit-taking at high levels and a rare divergence between gold and oil prices.
A hawkish outlook is imminent: the Fed's policy shift may be the final straw.
The Federal Reserve's March meeting kept interest rates unchanged at 3.50%-3.75%, and the dot plot indicated only one rate cut in 2026 (previously expected to be two), while inflation expectations were revised upward to 2.7%. The Chairman and several officials clearly stated that while oil-driven inflation risks are rising and signs of a cooling labor market exist, short-term headlines are insufficient to change the tightening path. The derivatives market even priced in two ECB rate hikes and one round of tightening by the Bank of England, with British and German bonds outperforming US bonds, but overall risk appetite retreated. The rebound in the US dollar and rising bond yields directly weakened gold's attractiveness as a non-interest-bearing asset. With a hawkish outlook now in place, the "currency devaluation trade" logic for gold has temporarily failed.
Summary: The peak of the gold bull market has been confirmed, and the short-term downward pressure pattern is unlikely to change.
The convergence of technical, financial, institutional, and macroeconomic signals, coupled with the realization of a hawkish outlook, has fully validated the assessment that gold has reached its peak. Currently, gold prices are fluctuating around $4300-$4400. Any rebound that fails to return to the upward channel and break through the neckline will be considered a "dead cat bounce." Unless there are clear signs of a US recession, the Federal Reserve returns to large-scale easing, or geopolitical conflicts completely ease and push down oil prices, gold is likely to maintain a weak, high-level consolidation pattern, with further downside potential.
In the long run, the structural logic of central bank gold purchases and de-dollarization has not disappeared, but in the short term, hawkish suppression and capital outflows have taken precedence. Investors should view the current pullback as a risk warning rather than a good opportunity to allocate funds—the peak has passed, and risk control should be the priority. The market always moves in accordance with expectations, and this abnormal trend of "gold falling due to war" is the best illustration of the hawkish outlook.
Technical analysis has issued the first warning of a top: the double-top pattern is now fully confirmed.
Gold prices retreated after two precise tops near $5336, breaking below the neckline (key support around $4400-$4000), forming a classic "M" double-top pattern. The MACD has formed a death cross, the RSI has fallen from overbought levels, and short-term moving averages are in a bearish alignment, with volume and price relationships indicating significantly increased selling pressure at the highs. The downside path has become the "path of least resistance," with a measured target of the $3600-$4000 range. This is not a short-term fluctuation, but rather a confirmation signal of profit-taking at high levels and a trend reversal.
(Spot gold weekly chart source: FX678)
Institutions have explicitly warned against overestimating the supporting role of central bank gold purchases.
A recent research report from China International Capital Corporation (CICC) bluntly states that "the motivation of global central banks to purchase gold should not be overestimated." Although emerging market central banks are still strategically increasing their holdings, developed countries are showing little interest, and central bank gold purchases are a long-term, slow-moving activity with very low sensitivity to short-term prices.
In fact, some central banks have already been selling gold. In January 2026, Russia became the largest net seller (selling 9 tons), the National Bank of Bulgaria sold 2 tons due to the euro's accession to the euro, and Kazakhstan and Kyrgyzstan each reduced their holdings by 1 ton. When gold prices rise too quickly, downward pressure is inevitable. Ordinary investors (especially ETF holders) are far more prone to "buying high and selling low" than central banks, a logic that has been fully validated in the current high-level fluctuations.
ETF outflows intensify: High-level selling becomes a reality
Holdings in the world's largest gold ETF, SPDR Gold Trust (GLD), have plummeted from over 1,070 tons in early March to 1,056.99 tons (as of March 20th), marking several consecutive days of net selling. March saw the largest outflow in 13 years, with cumulative outflows exceeding $6 billion over the past three weeks. North America led the outflows, while Europe also recorded net redemptions at times. The forced liquidation of leveraged positions and profit-taking have created a vicious cycle, further amplifying downward pressure on prices.
Gold's "strange" failure during the Iranian conflict: The safe-haven logic has been completely overturned.
Nearly a month after the outbreak of the Middle East conflict, gold prices not only failed to rise but instead plummeted by over 18% after an initial surge. The core reason for the failure of the traditional safe-haven logic lies in the fact that oil prices surged to over $100-102 per barrel due to the risk in the Strait of Hormuz, pushing up global inflation expectations and forcing the Federal Reserve to tighten policy. Safe-haven demand was completely overshadowed by the chain reaction of "oil prices → inflation → hawkish Fed → strong dollar," leading to profit-taking at high levels and a rare divergence between gold and oil prices.
A hawkish outlook is imminent: the Fed's policy shift may be the final straw.
The Federal Reserve's March meeting kept interest rates unchanged at 3.50%-3.75%, and the dot plot indicated only one rate cut in 2026 (previously expected to be two), while inflation expectations were revised upward to 2.7%. The Chairman and several officials clearly stated that while oil-driven inflation risks are rising and signs of a cooling labor market exist, short-term headlines are insufficient to change the tightening path. The derivatives market even priced in two ECB rate hikes and one round of tightening by the Bank of England, with British and German bonds outperforming US bonds, but overall risk appetite retreated. The rebound in the US dollar and rising bond yields directly weakened gold's attractiveness as a non-interest-bearing asset. With a hawkish outlook now in place, the "currency devaluation trade" logic for gold has temporarily failed.
Summary: The peak of the gold bull market has been confirmed, and the short-term downward pressure pattern is unlikely to change.
The convergence of technical, financial, institutional, and macroeconomic signals, coupled with the realization of a hawkish outlook, has fully validated the assessment that gold has reached its peak. Currently, gold prices are fluctuating around $4300-$4400. Any rebound that fails to return to the upward channel and break through the neckline will be considered a "dead cat bounce." Unless there are clear signs of a US recession, the Federal Reserve returns to large-scale easing, or geopolitical conflicts completely ease and push down oil prices, gold is likely to maintain a weak, high-level consolidation pattern, with further downside potential.
In the long run, the structural logic of central bank gold purchases and de-dollarization has not disappeared, but in the short term, hawkish suppression and capital outflows have taken precedence. Investors should view the current pullback as a risk warning rather than a good opportunity to allocate funds—the peak has passed, and risk control should be the priority. The market always moves in accordance with expectations, and this abnormal trend of "gold falling due to war" is the best illustration of the hawkish outlook.
- Risk Warning and Disclaimer
- The market involves risk, and trading may not be suitable for all investors. This article is for reference only and does not constitute personal investment advice, nor does it take into account certain users’ specific investment objectives, financial situation, or other needs. Any investment decisions made based on this information are at your own risk.