Silver prices fell back below the $70 mark.
2026-03-26 18:42:44
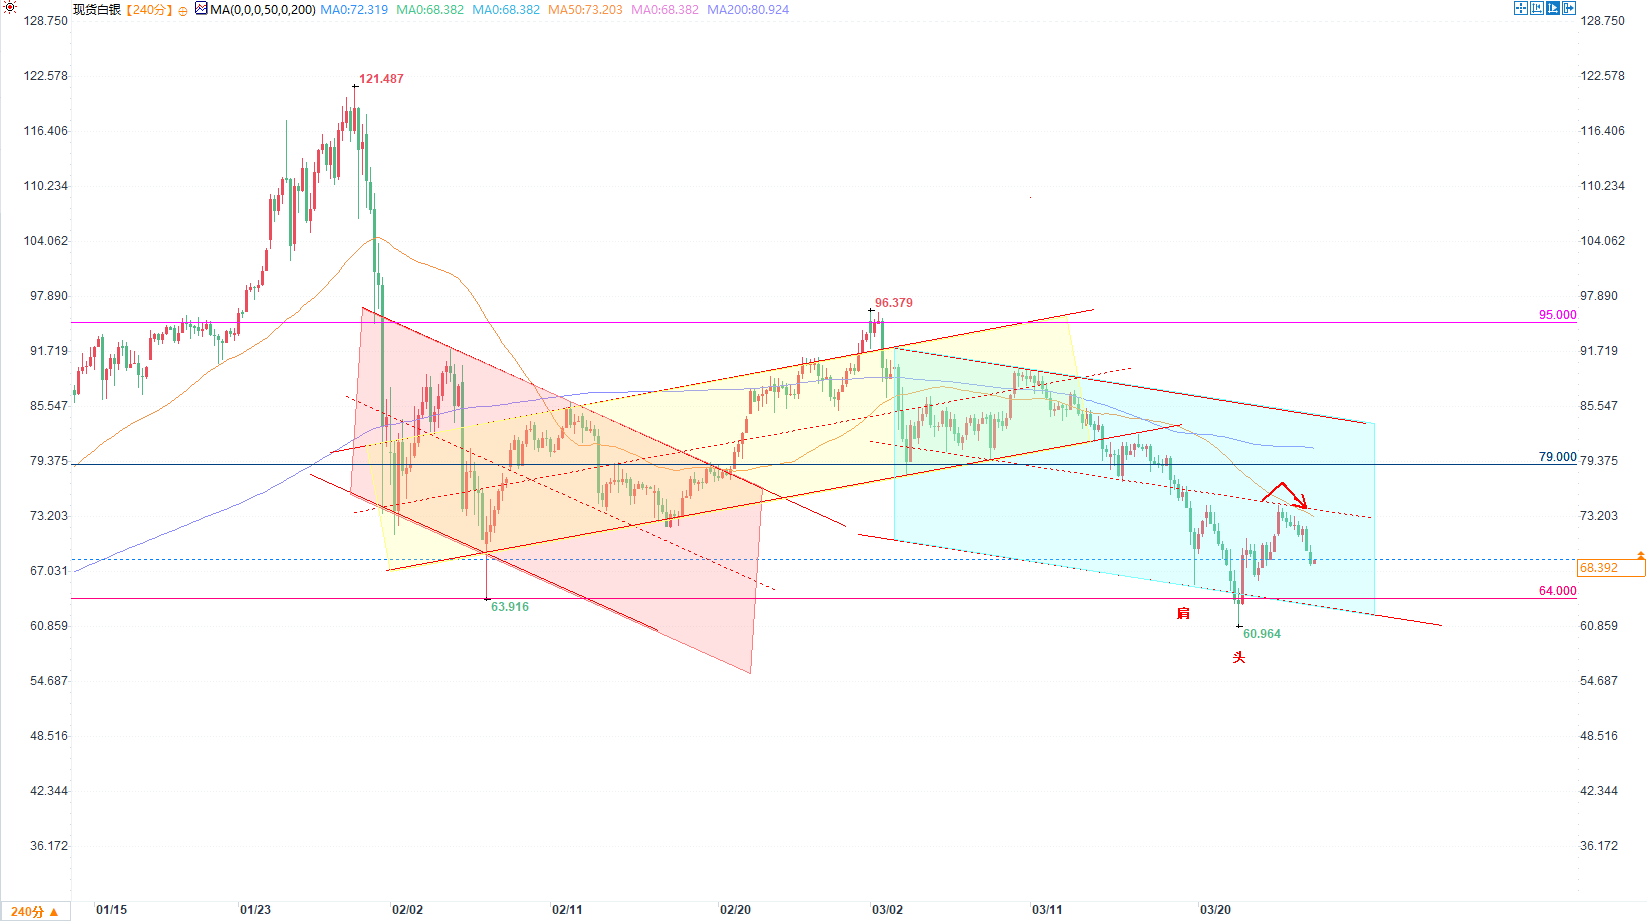
As can be clearly seen from the spot silver (XAG/USD) chart, silver prices have once again fallen below the key psychological level of $70. Meanwhile, silver prices have experienced significant volatility this week: on Monday, prices briefly fell below $65, while just yesterday, they climbed to a high of $74 per ounce.

The continued uncertainty surrounding the geopolitical situation is the core factor triggering sharp market volatility. Conflicting statements from the United States and Iran regarding potential peace talks continue to disrupt global financial markets. According to media reports:
The US says negotiations are still underway. It is understood that the Trump administration has submitted a 15-point proposal to Iran through intermediaries, aimed at resolving the conflict and reopening the Strait of Hormuz.
Iran has made it clear that it has no intention of negotiating with the United States, rejected the US ceasefire proposal, and put forward its own negotiating conditions.
On the morning of March 19th, when analyzing the spot silver (XAG/USD) price movement, we reached the following conclusions:
The market is facing significant downward selling pressure;
Draw a downward channel on the silver price chart (marked in cyan);
The midline of this channel will form a short-term resistance level, thus validating the effectiveness of this technical pattern.
Subsequent price movements fully validated the above analytical framework, as indicated by the arrows in the chart:
(4-hour chart of spot silver source: EasyForex)
On March 19, the lower channel line provided support for silver prices;
Yesterday, silver prices fell from the middle line of the channel (which has now become a resistance level), further reinforcing the bearish sentiment that has been building since March.
From a bullish perspective:
After silver prices fell below the low of around $64 on February 6, buying power surged in – so-called “smart money” (professional institutional funds) in the industry may have already absorbed liquidity in this price range, preparing for a subsequent surge in silver prices.
Silver prices may currently be forming a head and shoulders bottom pattern.
However, as long as silver prices remain below the middle line of the current cyan descending channel, it is still too early to conclude that the market has a clear bullish signal.
- Risk Warning and Disclaimer
- The market involves risk, and trading may not be suitable for all investors. This article is for reference only and does not constitute personal investment advice, nor does it take into account certain users’ specific investment objectives, financial situation, or other needs. Any investment decisions made based on this information are at your own risk.