A brief easing of tensions in the Middle East reduced demand for safe-haven assets, causing the US dollar index to fluctuate at high levels.
2026-03-27 13:51:35
The US dollar index edged lower in Asian trading on Friday, ending a three-day winning streak, and is currently trading around 99.90 . This pullback was primarily driven by a temporary improvement in market risk sentiment. Market surveys indicate that the US has indicated it will suspend potential actions against Middle Eastern energy facilities and extend the negotiation window. This statement has somewhat alleviated market concerns about further escalation of the situation, thereby reducing the safe-haven demand for the dollar.
However, the market remains cautious about the geopolitical situation. Reports indicate that Iran has not made any explicit requests, reflecting significant uncertainty regarding the current diplomatic progress. The fluctuating situation makes it difficult for the market to form a clear direction; while the US dollar has retreated in the short term, it remains generally supported.
From a macroeconomic perspective, inflation expectations remain one of the core factors influencing the dollar's trajectory. With rising energy prices, the market is concerned that inflationary pressures may resurface, potentially impacting the Federal Reserve's policy path. Recent statements from Fed officials have been cautious, suggesting that while rising energy prices have a limited short-term impact on inflation, a sustained shock could have a broader effect on the overall price system. This view has led the market to gradually weaken its expectations for interest rate cuts and even begin pricing in a possible rate hike this year.
Driven by changes in interest rate expectations, US Treasury yields remained high, providing significant support for the US dollar. Although improved risk sentiment weakened safe-haven demand, the interest rate differential advantage kept the dollar relatively strong, which is a key reason limiting the downside potential of the dollar index.
On the economic data front, initial jobless claims in the US remained at 210,000 , largely in line with market expectations, having a limited impact on the market and failing to provide new directional guidance for the US dollar. The market's focus is now shifting to the upcoming University of Michigan Consumer Sentiment Index and one-year inflation expectations data, which will provide important clues for assessing the resilience of consumption and inflation trends.
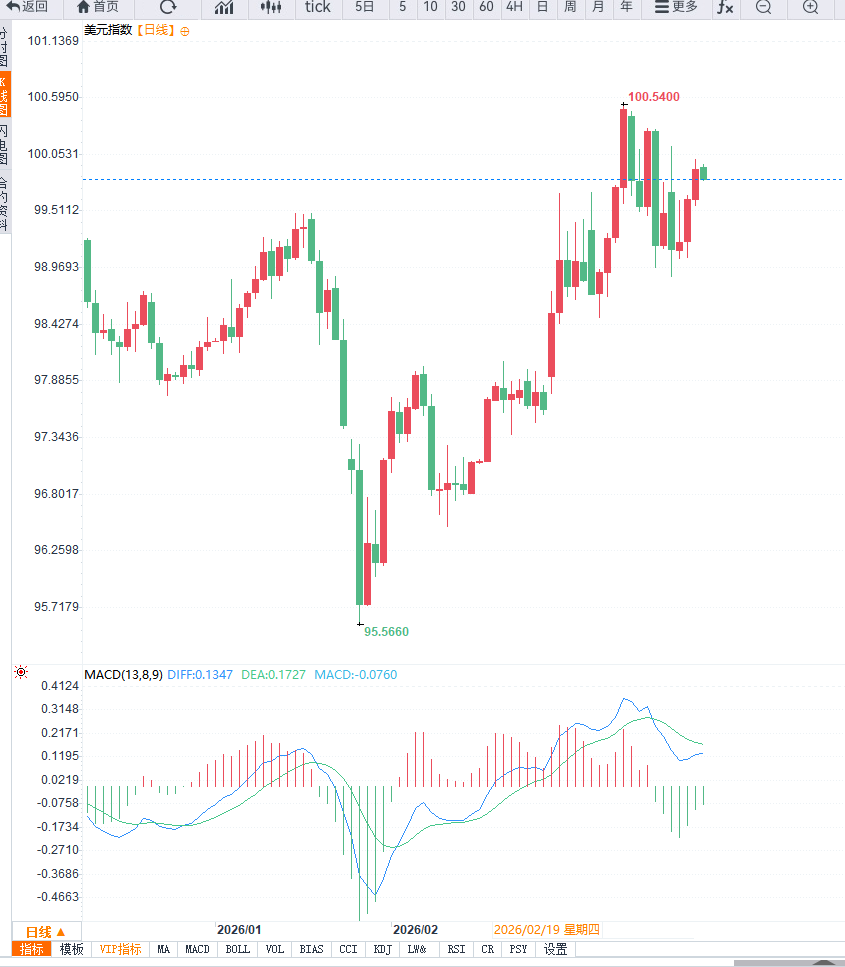
From a technical perspective, the US dollar index daily chart still maintains a slightly bullish, oscillating structure. After a previous rebound, the price encountered resistance and fell back near 100.50 , indicating some selling pressure above. Currently, the exchange rate is still trading above major moving averages, which are in a bullish alignment but with a slowing slope, suggesting a slowdown in upward momentum. The MACD is above the zero line, but the momentum bars are shortening, indicating weakening bullish momentum; the RSI has fallen back to the neutral zone, indicating the market has entered a consolidation phase. Key support levels are at 99.50 and 99.00 ; a break below these levels could lead to further pullback. Resistance levels to watch are 100.50 and 101.00 .
From the 4-hour chart, the short-term trend shows a pullback and consolidation pattern. After a continuous rise, a technical pullback has occurred, with the price falling back to near the moving averages, and the short-term moving averages gradually flattening. The MACD has fallen to near the zero line, indicating weakening short-term momentum; the RSI is around 50, reflecting a near balance between bullish and bearish forces. Short-term support levels to watch are 99.70 and 99.50 ; a break below these levels could lead to a further test of 99.00. Resistance is concentrated in the 100.20 and 100.50 area; a break above these levels is needed for a potential resumption of the upward trend.
Editor's Summary:
The current trend of the US dollar index exhibits a typical "dual-driven" characteristic: on the one hand, easing geopolitical tensions have weakened safe-haven demand, putting short-term pressure on the dollar; on the other hand, inflation expectations and interest rate prospects support the dollar's medium-term trend. Overall, the dollar may maintain a high-level consolidation pattern in the short term, with its direction depending on inflation data and changes in policy expectations. Investors should pay close attention to inflation indicators and statements from the Federal Reserve to determine the dollar's future trend.
However, the market remains cautious about the geopolitical situation. Reports indicate that Iran has not made any explicit requests, reflecting significant uncertainty regarding the current diplomatic progress. The fluctuating situation makes it difficult for the market to form a clear direction; while the US dollar has retreated in the short term, it remains generally supported.
From a macroeconomic perspective, inflation expectations remain one of the core factors influencing the dollar's trajectory. With rising energy prices, the market is concerned that inflationary pressures may resurface, potentially impacting the Federal Reserve's policy path. Recent statements from Fed officials have been cautious, suggesting that while rising energy prices have a limited short-term impact on inflation, a sustained shock could have a broader effect on the overall price system. This view has led the market to gradually weaken its expectations for interest rate cuts and even begin pricing in a possible rate hike this year.
Driven by changes in interest rate expectations, US Treasury yields remained high, providing significant support for the US dollar. Although improved risk sentiment weakened safe-haven demand, the interest rate differential advantage kept the dollar relatively strong, which is a key reason limiting the downside potential of the dollar index.
On the economic data front, initial jobless claims in the US remained at 210,000 , largely in line with market expectations, having a limited impact on the market and failing to provide new directional guidance for the US dollar. The market's focus is now shifting to the upcoming University of Michigan Consumer Sentiment Index and one-year inflation expectations data, which will provide important clues for assessing the resilience of consumption and inflation trends.
From a technical perspective, the US dollar index daily chart still maintains a slightly bullish, oscillating structure. After a previous rebound, the price encountered resistance and fell back near 100.50 , indicating some selling pressure above. Currently, the exchange rate is still trading above major moving averages, which are in a bullish alignment but with a slowing slope, suggesting a slowdown in upward momentum. The MACD is above the zero line, but the momentum bars are shortening, indicating weakening bullish momentum; the RSI has fallen back to the neutral zone, indicating the market has entered a consolidation phase. Key support levels are at 99.50 and 99.00 ; a break below these levels could lead to further pullback. Resistance levels to watch are 100.50 and 101.00 .
From the 4-hour chart, the short-term trend shows a pullback and consolidation pattern. After a continuous rise, a technical pullback has occurred, with the price falling back to near the moving averages, and the short-term moving averages gradually flattening. The MACD has fallen to near the zero line, indicating weakening short-term momentum; the RSI is around 50, reflecting a near balance between bullish and bearish forces. Short-term support levels to watch are 99.70 and 99.50 ; a break below these levels could lead to a further test of 99.00. Resistance is concentrated in the 100.20 and 100.50 area; a break above these levels is needed for a potential resumption of the upward trend.
Editor's Summary:
The current trend of the US dollar index exhibits a typical "dual-driven" characteristic: on the one hand, easing geopolitical tensions have weakened safe-haven demand, putting short-term pressure on the dollar; on the other hand, inflation expectations and interest rate prospects support the dollar's medium-term trend. Overall, the dollar may maintain a high-level consolidation pattern in the short term, with its direction depending on inflation data and changes in policy expectations. Investors should pay close attention to inflation indicators and statements from the Federal Reserve to determine the dollar's future trend.
- Risk Warning and Disclaimer
- The market involves risk, and trading may not be suitable for all investors. This article is for reference only and does not constitute personal investment advice, nor does it take into account certain users’ specific investment objectives, financial situation, or other needs. Any investment decisions made based on this information are at your own risk.