Silver prices tested the 100-day moving average; the path to a bottom was fraught with setbacks.
2026-04-01 19:44:03
The silver market witnessed a familiar scene again this week: prices seemed poised for a breakout, yet consistently struggled to break free from the strong resistance of the 100-day moving average. Despite the overall macroeconomic environment being unfavorable for risk assets, silver prices demonstrated strong resilience over the past week, successfully holding above the interim low reached on March 23.

From a technical perspective, the rebound from the low point (the support zone formed by the April 2025 uptrend line and the February 6th low of $64.10) has begun to show signs of bottoming out. This positive signal was further confirmed on Tuesday after silver prices successfully broke through the downtrend line that had been exerting downward pressure since the end of January. However, the improvement in technicals has not completely reversed market sentiment. The biggest challenge for the bulls right now is the 100-day moving average. In the past few weeks, silver prices have repeatedly attempted to challenge this key moving average, but all attempts have failed, with last week's surge and subsequent pullback being the latest example. Currently, the price is once again suppressed below the 100-day moving average, and this repeated "top-to-bottom" pullback has made investors somewhat hesitant about a short-term breakout. From a trading strategy perspective, the current price's close proximity to the 100-day moving average creates a good risk-reward ratio opportunity for short-term traders:
Bullish scenario: If silver prices can break through and hold above the 100-day moving average with increased volume, bulls can actively enter the market, establish long positions, and set protective stop-loss orders not far below the moving average to control risk.
Bearish scenario: If silver prices encounter resistance and fall back near this moving average again, short sellers can enter the market and establish short positions, with stop loss set above the 100-day moving average.
Analysis of key resistance levels above:
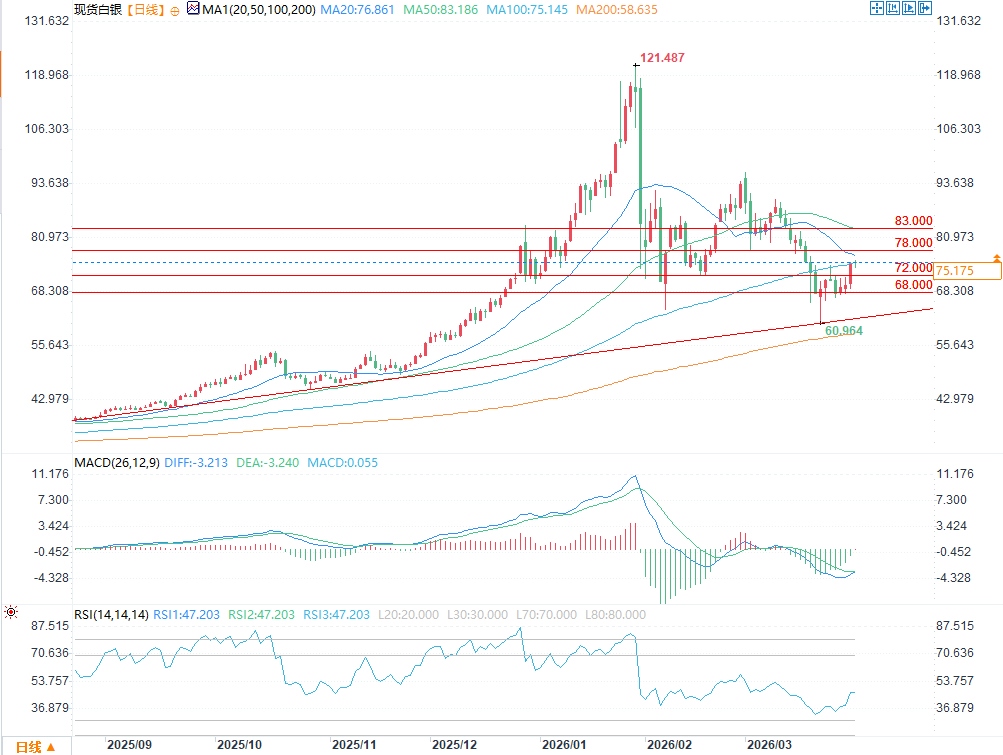
(Spot silver daily chart source: EasyTrade)
$78: This price level has played an important role in silver price movements many times this year, serving as both a key support and strong resistance level, and is therefore of great interest.
The 50-day moving average: As an important reference indicator for short- to medium-term trends, a breakout will further strengthen the bullish momentum.
$90.50: This is the high point on March 10th, a significant level marking the recent swing high.
$96: A strong resistance zone in the longer term. If it can be broken through step by step, it will open up greater upside potential.
Analysis of key support levels below:
$72: Silver prices were repeatedly blocked at this level before breaking through last week, making it a key price level that cannot be ignored in recent short-term trading.
$68: Bulls actively defended this area in the second half of March, making it an important turning point in sentiment.
The $64.10 area: This strong support zone, formed by the August 2025 uptrend line and the February 6th horizontal support, is a potential profit target for short sellers and an ideal area for longs to buy on dips after a deep pullback.
Technical indicators corroborate this: The bearish momentum is gradually weakening. The performance of technical indicators is highly consistent with price action, further confirming that the market is gradually shifting from a one-sided downward trend to a balanced consolidation. The Relative Strength Index (RSI) (14) continues to recover upwards and is now approaching the neutral threshold of 50, indicating that selling pressure is gradually easing. The MACD indicator has also achieved a golden cross from below, and although the histogram is still in negative territory, this signal indicates that downward momentum is clearly waning. Combining the signals from both price and indicators, the short-term market risk has shifted from a clear downward bias to a more balanced state. Investors need to closely monitor the final breakout direction of the 100-day moving average to determine their subsequent trading strategies.
Overall, silver prices are currently at a critical technical turning point: initial bottoming signals have emerged, but a decisive break above the 100-day moving average, a "stubborn resistance wall," is still needed to truly confirm a trend reversal. In the short term, the market will likely see repeated struggles around the 100-day moving average, and traders should remain flexible and adjust their positions promptly based on actual breakouts.
At 19:34 Beijing time, spot silver was trading at $75.245 per ounce, up 0.23%.
From a technical perspective, the rebound from the low point (the support zone formed by the April 2025 uptrend line and the February 6th low of $64.10) has begun to show signs of bottoming out. This positive signal was further confirmed on Tuesday after silver prices successfully broke through the downtrend line that had been exerting downward pressure since the end of January. However, the improvement in technicals has not completely reversed market sentiment. The biggest challenge for the bulls right now is the 100-day moving average. In the past few weeks, silver prices have repeatedly attempted to challenge this key moving average, but all attempts have failed, with last week's surge and subsequent pullback being the latest example. Currently, the price is once again suppressed below the 100-day moving average, and this repeated "top-to-bottom" pullback has made investors somewhat hesitant about a short-term breakout. From a trading strategy perspective, the current price's close proximity to the 100-day moving average creates a good risk-reward ratio opportunity for short-term traders:
Bullish scenario: If silver prices can break through and hold above the 100-day moving average with increased volume, bulls can actively enter the market, establish long positions, and set protective stop-loss orders not far below the moving average to control risk.
Bearish scenario: If silver prices encounter resistance and fall back near this moving average again, short sellers can enter the market and establish short positions, with stop loss set above the 100-day moving average.
Analysis of key resistance levels above:
(Spot silver daily chart source: EasyTrade)
$78: This price level has played an important role in silver price movements many times this year, serving as both a key support and strong resistance level, and is therefore of great interest.
The 50-day moving average: As an important reference indicator for short- to medium-term trends, a breakout will further strengthen the bullish momentum.
$90.50: This is the high point on March 10th, a significant level marking the recent swing high.
$96: A strong resistance zone in the longer term. If it can be broken through step by step, it will open up greater upside potential.
Analysis of key support levels below:
$72: Silver prices were repeatedly blocked at this level before breaking through last week, making it a key price level that cannot be ignored in recent short-term trading.
$68: Bulls actively defended this area in the second half of March, making it an important turning point in sentiment.
The $64.10 area: This strong support zone, formed by the August 2025 uptrend line and the February 6th horizontal support, is a potential profit target for short sellers and an ideal area for longs to buy on dips after a deep pullback.
Technical indicators corroborate this: The bearish momentum is gradually weakening. The performance of technical indicators is highly consistent with price action, further confirming that the market is gradually shifting from a one-sided downward trend to a balanced consolidation. The Relative Strength Index (RSI) (14) continues to recover upwards and is now approaching the neutral threshold of 50, indicating that selling pressure is gradually easing. The MACD indicator has also achieved a golden cross from below, and although the histogram is still in negative territory, this signal indicates that downward momentum is clearly waning. Combining the signals from both price and indicators, the short-term market risk has shifted from a clear downward bias to a more balanced state. Investors need to closely monitor the final breakout direction of the 100-day moving average to determine their subsequent trading strategies.
Overall, silver prices are currently at a critical technical turning point: initial bottoming signals have emerged, but a decisive break above the 100-day moving average, a "stubborn resistance wall," is still needed to truly confirm a trend reversal. In the short term, the market will likely see repeated struggles around the 100-day moving average, and traders should remain flexible and adjust their positions promptly based on actual breakouts.
At 19:34 Beijing time, spot silver was trading at $75.245 per ounce, up 0.23%.
- Risk Warning and Disclaimer
- The market involves risk, and trading may not be suitable for all investors. This article is for reference only and does not constitute personal investment advice, nor does it take into account certain users’ specific investment objectives, financial situation, or other needs. Any investment decisions made based on this information are at your own risk.