With the market closed for the holiday and four consecutive days of gains under control, will gold surge to 4800 or retrace to 4550 when it opens on Monday?
2026-04-03 19:24:24
The global gold market demonstrated strong intrinsic momentum during the week of March 31 to April 3, 2026, despite a shortened trading week. Influenced by the Good Friday holiday, both spot gold and COMEX gold futures recorded significant gains despite the reduced number of actual trading days. Spot gold rose 4.02% during the week, marking its largest weekly gain since the end of 2025; COMEX gold futures performed even more aggressively, with a weekly increase of 4.74%.
The core logic behind this week's market movement lies in the confirmation of a bullish divergence on the technical charts and the interplay between bullish and bearish macroeconomic fundamentals. Despite short-term pressure from a strong dollar, the attractiveness of safe-haven assets has rapidly rebounded against the backdrop of continued spillover of geopolitical risks and rising long-term inflation expectations among major overseas institutions. Gold prices not only recovered the losses of late March but also sent a strong short-term trend reversal signal to the market through a four-day winning streak on the daily chart.

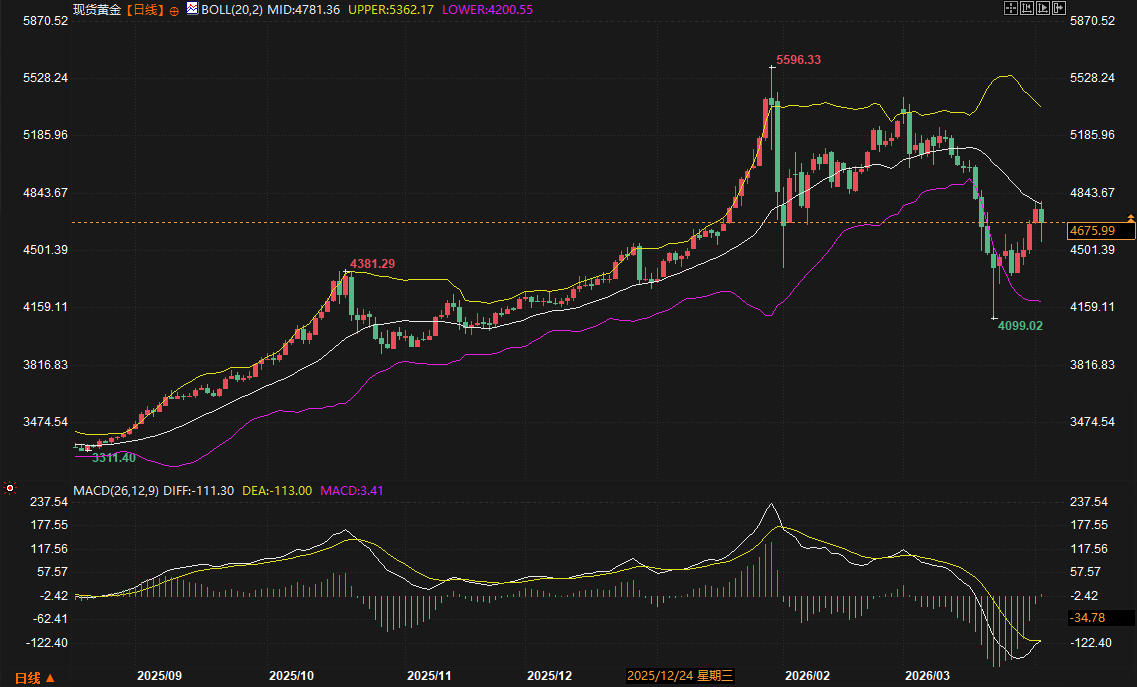
Spot gold showed a clear step-by-step upward trend this week. Starting from around $4,416 at the beginning of the week, it broke through the two important psychological levels of $4,500 and $4,600, reaching a high of $4,700.
1. Price Fluctuations and K-line Logic <br/>At the beginning of the week, the market was at the tail end of a pessimistic sentiment. On Monday (March 31), the price stabilized at the support level of $4450, forming an initial bottom. In the following three trading days, the price rose with increased volume, successively breaking through multiple resistance zones below the Bollinger Band middle line. On Thursday (April 3), the closing price approached $4700, showing strong bullish confidence.
2. Economic Data and Key Events <br/>This week's external environment was exceptionally complex. Major overseas institutions noted that the evolving situation in Russia and Ukraine, along with the escalation of military operations in the Middle East, significantly boosted energy price expectations. While traditionally, rising oil prices could trigger inflationary concerns and lead to central bank interest rate hikes, thus negatively impacting gold, the market currently favors trading based on the "inflation hedge" logic. Furthermore, concerns about supply chain stability from some sovereign nations, influenced by tariff rhetoric , indirectly supported safe-haven demand.
3. Technical Indicator Analysis <br/>Currently, the MACD histogram on the daily chart is expanding, and although the DIFF and DEA lines are still below the zero line, a bullish divergence pattern is clear. Regarding the Bollinger Bands, the price has rebounded from the lower band ($4200.55) to near the middle band. Major overseas institutions believe that the middle band resistance level of $4781 will be the key battleground for bulls and bears next week.
The futures market exhibited a higher beta this week, outperforming the spot market, reflecting that professional speculative capital and hedge funds are reassessing the allocation value of gold.
1. Trend Review
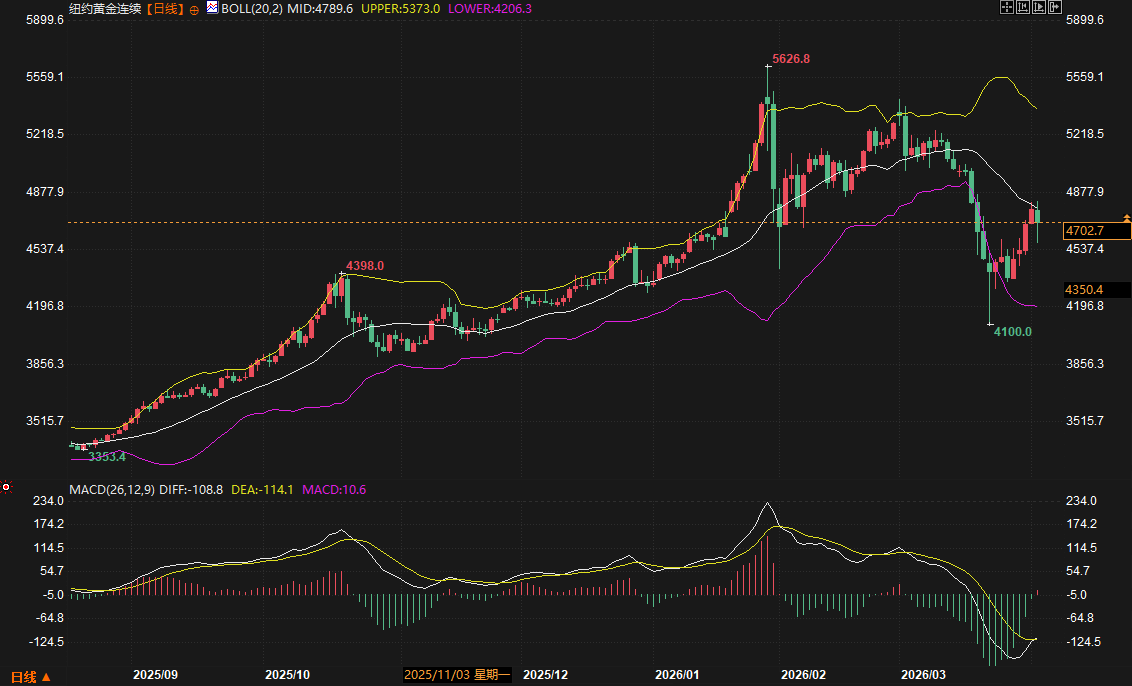
COMEX gold closed the week at $4,702.7 per ounce, a rebound of over 14% from the March low of $4,100. Wednesday's gap up was the turning point of the week, and the gap remained unfilled in the following two trading days, indicating extremely strong upward momentum.
2. Deduplicated Summary of Institutional Views <br />Regarding this week's rebound, mainstream overseas institutions generally hold the following views:
Liquidity premium returns: Some institutions point out that the Turkish central bank's recent reduction in gold reserves (approximately 118 tons in two weeks) is not simply a sign of a bearish outlook on gold prices, but rather an attempt to mitigate the impact on the domestic market under specific geopolitical pressures. This sovereign-level sell-off initially caused market panic, but it also provided long-term buyers with a more favorable entry cost.
Macroeconomic game escalates: A well-known foreign media analysis suggests that the recent tough stance of the US government on overseas situations, while pushing up the dollar exchange rate, has also made the market realize that global inflationary pressures may be protracted. This coexistence of a "high dollar and high gold price" is essentially a premium compensation for currency credit risk.
Spot demand diverged: Asian markets showed strong resilience. Indian gold trading saw its first premium in two months, indicating that physical gold demand was quickly released after the price correction; while Chinese market buyers were relatively cautious, exhibiting a clear left-side positioning characteristic.
In summary, the four-day winning streak in the gold market this week was not accidental, but rather a result of a combination of technical oversold correction and macroeconomic risk premium. The closing price of $4700 is not just a number, but also a symbol of the bulls regaining control. However, investors should not ignore potential volatility risks: on the one hand, the strength of the US dollar index continues to put heavy pressure on dollar-denominated precious metals; on the other hand, interest rate hike expectations triggered by energy price fluctuations could become the bulls' Achilles' heel at any time. Looking ahead to next week, if gold prices can effectively stabilize and break through $4800, gold will officially transition from a "rebound" to a "counter-offensive" phase; otherwise, it may fall into a new round of range-bound trading.
Question 1: Gold has seen four consecutive days of gains this week, accompanied by a MACD bullish divergence. Does this mean that the correction since March has completely ended?
Current signals suggest a short-term bottoming pattern is forming, but it's too early to declare the major correction over. The emergence of a bullish divergence indicates a temporary exhaustion of bearish momentum, especially with prices finding solid support above $4400, confirming a medium-term valuation bottom. However, prices are currently in a crucial consolidation zone around the Bollinger Band's middle line. Failure to break through the resistance near $4800 could still pose a risk of a double-dip. This current movement resembles a correction after the previous oversold condition; a true reversal would require clearer expectations of interest rate cuts or a more severe evolution of the macroeconomic situation.
Question 2: Why did gold prices surge in a single week despite the recent large-scale reduction of gold holdings by the Central Bank of Türkiye?
This seemingly contradictory phenomenon actually reflects the market's insensitivity to negative news. The Turkish central bank 's sell-off was primarily aimed at offsetting the financial shock caused by the domestic war situation, representing a passive reduction rather than a trend-driven bearish stance. Once this definite negative news materialized, market selling pressure actually eased. Simultaneously, the return of premiums in physical markets like India offset the impact of the official sell-off. This indicates that the microstructure of gold has shifted from "sell-off driven" to "demand driven," with the large-scale sell-off being absorbed by the market, demonstrating the extremely strong support within the current price range.
Question 3: Why is the logic behind gold's rebound different from the past in the current "high dollar" environment?
Traditionally, the US dollar and gold have a strong negative correlation. However, even with a stronger dollar this week, gold prices still recorded gains of over 4%, indicating the dominance of "risk premiums." Uncertainty surrounding tariffs and the Russia-Ukraine situation has led the market to question the effectiveness of the US dollar as a single safe-haven asset. When global inflation expectations spiral out of control due to rising energy prices, gold's attributes as a "hard currency" surpass its role as a currency hedge. At this point, gold trading is no longer about interest rate differentials, but rather about credit risk and the probability of runaway inflation. This reshaping of logic is the core driving force behind this week's rebound.
Question 4: How to understand the interplay between "inflation hedging" and "interest rate hike expectations" mentioned by mainstream overseas institutions?
This is a dynamic equilibrium. Rising energy prices, on the one hand, push up inflation, supporting gold prices; on the other hand, they trigger expectations of interest rate hikes, increasing the opportunity cost of holding gold. Currently, the bulls are in control because the market believes the room for further interest rate hikes has diminished, while inflation is stickier than expected. In other words, even if interest rates remain high, as long as the real interest rate (nominal interest rate minus inflation rate) cannot significantly turn positive, gold's function as a store of value will continue to attract long-term capital. This game will be the main theme of gold pricing in the coming months, determining whether gold prices will fluctuate upwards or remain range-bound at high levels.
Question 5: For next week's trading, what are the key points that are the "weathervanes" for determining the strength of the bulls and bears?
The primary focus is the $4780-$4800 range. This is the common Bollinger Band middle line resistance zone for both spot and futures prices. A breakout with a large bullish candle on high volume would establish a new upward channel. Secondly, it's crucial to monitor whether oil prices continue to hold high. If a decline in oil prices cools inflation expectations while the dollar remains strong, gold prices may retest the $4550 support level. Finally, pay attention to the latest developments in tariff rhetoric ; any escalation of trade tensions will act as a catalyst for the bulls. Overall, the market is currently in a bullish atmosphere where "rising prices are more likely than falling prices," but caution is advised when chasing highs.
The core logic behind this week's market movement lies in the confirmation of a bullish divergence on the technical charts and the interplay between bullish and bearish macroeconomic fundamentals. Despite short-term pressure from a strong dollar, the attractiveness of safe-haven assets has rapidly rebounded against the backdrop of continued spillover of geopolitical risks and rising long-term inflation expectations among major overseas institutions. Gold prices not only recovered the losses of late March but also sent a strong short-term trend reversal signal to the market through a four-day winning streak on the daily chart.
Spot Gold (London Gold) Price Movement Review and Data Analysis
Spot gold showed a clear step-by-step upward trend this week. Starting from around $4,416 at the beginning of the week, it broke through the two important psychological levels of $4,500 and $4,600, reaching a high of $4,700.
1. Price Fluctuations and K-line Logic <br/>At the beginning of the week, the market was at the tail end of a pessimistic sentiment. On Monday (March 31), the price stabilized at the support level of $4450, forming an initial bottom. In the following three trading days, the price rose with increased volume, successively breaking through multiple resistance zones below the Bollinger Band middle line. On Thursday (April 3), the closing price approached $4700, showing strong bullish confidence.
2. Economic Data and Key Events <br/>This week's external environment was exceptionally complex. Major overseas institutions noted that the evolving situation in Russia and Ukraine, along with the escalation of military operations in the Middle East, significantly boosted energy price expectations. While traditionally, rising oil prices could trigger inflationary concerns and lead to central bank interest rate hikes, thus negatively impacting gold, the market currently favors trading based on the "inflation hedge" logic. Furthermore, concerns about supply chain stability from some sovereign nations, influenced by tariff rhetoric , indirectly supported safe-haven demand.
3. Technical Indicator Analysis <br/>Currently, the MACD histogram on the daily chart is expanding, and although the DIFF and DEA lines are still below the zero line, a bullish divergence pattern is clear. Regarding the Bollinger Bands, the price has rebounded from the lower band ($4200.55) to near the middle band. Major overseas institutions believe that the middle band resistance level of $4781 will be the key battleground for bulls and bears next week.
Summary of New York Gold Futures (COMEX) Market Performance and Institutional Views
The futures market exhibited a higher beta this week, outperforming the spot market, reflecting that professional speculative capital and hedge funds are reassessing the allocation value of gold.
1. Trend Review
COMEX gold closed the week at $4,702.7 per ounce, a rebound of over 14% from the March low of $4,100. Wednesday's gap up was the turning point of the week, and the gap remained unfilled in the following two trading days, indicating extremely strong upward momentum.
2. Deduplicated Summary of Institutional Views <br />Regarding this week's rebound, mainstream overseas institutions generally hold the following views:
Liquidity premium returns: Some institutions point out that the Turkish central bank's recent reduction in gold reserves (approximately 118 tons in two weeks) is not simply a sign of a bearish outlook on gold prices, but rather an attempt to mitigate the impact on the domestic market under specific geopolitical pressures. This sovereign-level sell-off initially caused market panic, but it also provided long-term buyers with a more favorable entry cost.
Macroeconomic game escalates: A well-known foreign media analysis suggests that the recent tough stance of the US government on overseas situations, while pushing up the dollar exchange rate, has also made the market realize that global inflationary pressures may be protracted. This coexistence of a "high dollar and high gold price" is essentially a premium compensation for currency credit risk.
Spot demand diverged: Asian markets showed strong resilience. Indian gold trading saw its first premium in two months, indicating that physical gold demand was quickly released after the price correction; while Chinese market buyers were relatively cautious, exhibiting a clear left-side positioning characteristic.
Safe-haven assets on the balance beam
In summary, the four-day winning streak in the gold market this week was not accidental, but rather a result of a combination of technical oversold correction and macroeconomic risk premium. The closing price of $4700 is not just a number, but also a symbol of the bulls regaining control. However, investors should not ignore potential volatility risks: on the one hand, the strength of the US dollar index continues to put heavy pressure on dollar-denominated precious metals; on the other hand, interest rate hike expectations triggered by energy price fluctuations could become the bulls' Achilles' heel at any time. Looking ahead to next week, if gold prices can effectively stabilize and break through $4800, gold will officially transition from a "rebound" to a "counter-offensive" phase; otherwise, it may fall into a new round of range-bound trading.
QA Module: In-depth Analysis of Core Logic
Question 1: Gold has seen four consecutive days of gains this week, accompanied by a MACD bullish divergence. Does this mean that the correction since March has completely ended?
Current signals suggest a short-term bottoming pattern is forming, but it's too early to declare the major correction over. The emergence of a bullish divergence indicates a temporary exhaustion of bearish momentum, especially with prices finding solid support above $4400, confirming a medium-term valuation bottom. However, prices are currently in a crucial consolidation zone around the Bollinger Band's middle line. Failure to break through the resistance near $4800 could still pose a risk of a double-dip. This current movement resembles a correction after the previous oversold condition; a true reversal would require clearer expectations of interest rate cuts or a more severe evolution of the macroeconomic situation.
Question 2: Why did gold prices surge in a single week despite the recent large-scale reduction of gold holdings by the Central Bank of Türkiye?
This seemingly contradictory phenomenon actually reflects the market's insensitivity to negative news. The Turkish central bank 's sell-off was primarily aimed at offsetting the financial shock caused by the domestic war situation, representing a passive reduction rather than a trend-driven bearish stance. Once this definite negative news materialized, market selling pressure actually eased. Simultaneously, the return of premiums in physical markets like India offset the impact of the official sell-off. This indicates that the microstructure of gold has shifted from "sell-off driven" to "demand driven," with the large-scale sell-off being absorbed by the market, demonstrating the extremely strong support within the current price range.
Question 3: Why is the logic behind gold's rebound different from the past in the current "high dollar" environment?
Traditionally, the US dollar and gold have a strong negative correlation. However, even with a stronger dollar this week, gold prices still recorded gains of over 4%, indicating the dominance of "risk premiums." Uncertainty surrounding tariffs and the Russia-Ukraine situation has led the market to question the effectiveness of the US dollar as a single safe-haven asset. When global inflation expectations spiral out of control due to rising energy prices, gold's attributes as a "hard currency" surpass its role as a currency hedge. At this point, gold trading is no longer about interest rate differentials, but rather about credit risk and the probability of runaway inflation. This reshaping of logic is the core driving force behind this week's rebound.
Question 4: How to understand the interplay between "inflation hedging" and "interest rate hike expectations" mentioned by mainstream overseas institutions?
This is a dynamic equilibrium. Rising energy prices, on the one hand, push up inflation, supporting gold prices; on the other hand, they trigger expectations of interest rate hikes, increasing the opportunity cost of holding gold. Currently, the bulls are in control because the market believes the room for further interest rate hikes has diminished, while inflation is stickier than expected. In other words, even if interest rates remain high, as long as the real interest rate (nominal interest rate minus inflation rate) cannot significantly turn positive, gold's function as a store of value will continue to attract long-term capital. This game will be the main theme of gold pricing in the coming months, determining whether gold prices will fluctuate upwards or remain range-bound at high levels.
Question 5: For next week's trading, what are the key points that are the "weathervanes" for determining the strength of the bulls and bears?
The primary focus is the $4780-$4800 range. This is the common Bollinger Band middle line resistance zone for both spot and futures prices. A breakout with a large bullish candle on high volume would establish a new upward channel. Secondly, it's crucial to monitor whether oil prices continue to hold high. If a decline in oil prices cools inflation expectations while the dollar remains strong, gold prices may retest the $4550 support level. Finally, pay attention to the latest developments in tariff rhetoric ; any escalation of trade tensions will act as a catalyst for the bulls. Overall, the market is currently in a bullish atmosphere where "rising prices are more likely than falling prices," but caution is advised when chasing highs.
- Risk Warning and Disclaimer
- The market involves risk, and trading may not be suitable for all investors. This article is for reference only and does not constitute personal investment advice, nor does it take into account certain users’ specific investment objectives, financial situation, or other needs. Any investment decisions made based on this information are at your own risk.