A ceasefire between the US and Iran put pressure on the dollar, pushing gold prices to a three-week high.
2026-04-08 13:58:56
Gold extended its rebound from around $4,600 the previous day, rising for the second consecutive trading day and briefly hitting a near three-week high during Wednesday's Asian session. However, the precious metal subsequently gave back some of its intraday gains and is currently trading near the $4,830 level, still up about 2.8% on the day, mainly due to a weaker dollar.
The US dollar index fell sharply on news of a ceasefire between the US and Iran, hitting a near one-month low. US President Trump announced on Truth Social that the US would suspend planned military strikes against Iran for two weeks if Iran agreed to a full, immediate, and safe opening of the Strait of Hormuz. Iran stated it had accepted the two-week ceasefire and would begin negotiations in Islamabad, Pakistan, on Friday. This news boosted market confidence, weakened the dollar's status as the global reserve currency, and thus benefited gold prices.

Meanwhile, Iranian Foreign Minister Seyed Abbas Araghchi stated in a press release that safe passage through key waterways would resume within two weeks, causing a sharp drop in crude oil prices. This change eased market concerns about inflation and lowered expectations for a Federal Reserve rate hike. US Treasury yields consequently fell, further pressuring the dollar and providing additional support for non-interest-bearing gold. However, the lack of sustained buying interest means that gold bulls should remain cautious before adding to their positions.
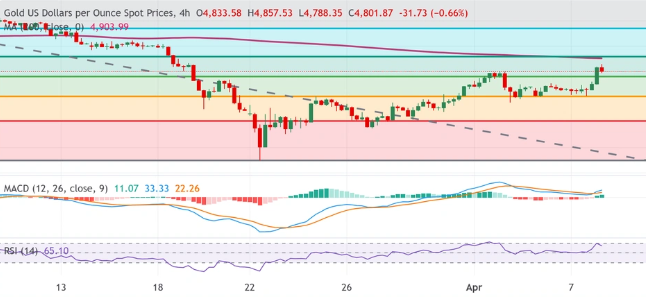
Chart: Gold 4-hour chart
From a technical perspective, gold's short-term trend is mildly bullish, as prices have recovered to the middle of the recent consolidation range. However, on the 4-hour chart, gold prices remain below the 200-period simple moving average (SMA), which coincides with the 61.8% Fibonacci retracement level of the March decline, thus keeping the overall trend under pressure.
Meanwhile, the MACD indicator line crossed above the zero axis into positive territory, and the histogram continued to expand, indicating that the upward momentum after the previous correction is strengthening. The Relative Strength Index (RSI) hovered above the 60 neutral zone, maintaining a positive signal, but has not yet entered the overbought extreme zone.
Nevertheless, investors should remain cautious until gold prices break through the key resistance level of $4,920. Only after firmly establishing themselves above this level should they consider further upward movement towards the psychological level of $5,000, and the next target, the 78.6% Fibonacci retracement level of the March decline at $5,141.
The nearest support level is near the 50% retracement level, around $4,750. A break below this level could lead to a further decline towards the 38.2% Fibonacci retracement level at $4,605. Further key support lies near the 23.6% retracement level at $4,411. A break below this level would weaken the current bullish bias and open up further downside potential.
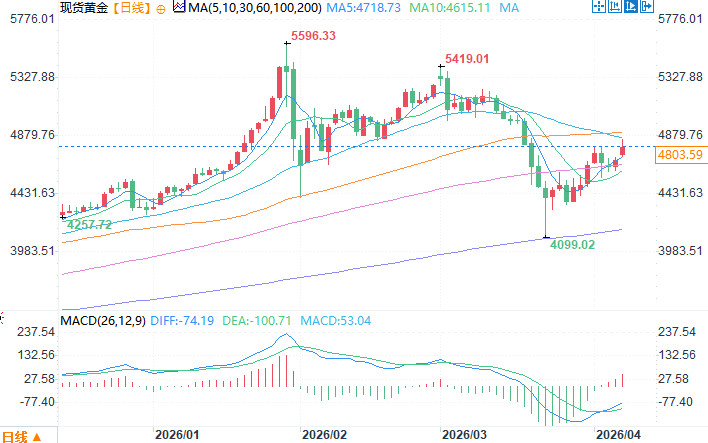
Spot gold daily chart source: EasyForex
At 13:58 Beijing time on April 8, spot gold was trading at $4,826.83 per ounce.
The US dollar index fell sharply on news of a ceasefire between the US and Iran, hitting a near one-month low. US President Trump announced on Truth Social that the US would suspend planned military strikes against Iran for two weeks if Iran agreed to a full, immediate, and safe opening of the Strait of Hormuz. Iran stated it had accepted the two-week ceasefire and would begin negotiations in Islamabad, Pakistan, on Friday. This news boosted market confidence, weakened the dollar's status as the global reserve currency, and thus benefited gold prices.
Meanwhile, Iranian Foreign Minister Seyed Abbas Araghchi stated in a press release that safe passage through key waterways would resume within two weeks, causing a sharp drop in crude oil prices. This change eased market concerns about inflation and lowered expectations for a Federal Reserve rate hike. US Treasury yields consequently fell, further pressuring the dollar and providing additional support for non-interest-bearing gold. However, the lack of sustained buying interest means that gold bulls should remain cautious before adding to their positions.
Chart: Gold 4-hour chart
From a technical perspective, gold's short-term trend is mildly bullish, as prices have recovered to the middle of the recent consolidation range. However, on the 4-hour chart, gold prices remain below the 200-period simple moving average (SMA), which coincides with the 61.8% Fibonacci retracement level of the March decline, thus keeping the overall trend under pressure.
Meanwhile, the MACD indicator line crossed above the zero axis into positive territory, and the histogram continued to expand, indicating that the upward momentum after the previous correction is strengthening. The Relative Strength Index (RSI) hovered above the 60 neutral zone, maintaining a positive signal, but has not yet entered the overbought extreme zone.
Nevertheless, investors should remain cautious until gold prices break through the key resistance level of $4,920. Only after firmly establishing themselves above this level should they consider further upward movement towards the psychological level of $5,000, and the next target, the 78.6% Fibonacci retracement level of the March decline at $5,141.
The nearest support level is near the 50% retracement level, around $4,750. A break below this level could lead to a further decline towards the 38.2% Fibonacci retracement level at $4,605. Further key support lies near the 23.6% retracement level at $4,411. A break below this level would weaken the current bullish bias and open up further downside potential.
Spot gold daily chart source: EasyForex
At 13:58 Beijing time on April 8, spot gold was trading at $4,826.83 per ounce.
- Risk Warning and Disclaimer
- The market involves risk, and trading may not be suitable for all investors. This article is for reference only and does not constitute personal investment advice, nor does it take into account certain users’ specific investment objectives, financial situation, or other needs. Any investment decisions made based on this information are at your own risk.