LME copper just hit a three-week high, so why is it already on the countdown to a breakdown?
2026-04-09 17:59:33
On Thursday (April 9th), amid a complex and volatile global macroeconomic environment, the non-ferrous metals market generally exhibited a clear downward trend. Influenced by changes in the international geopolitical situation, the market harbored doubts about the sustainability of previously reached ceasefire agreements in some regions. This uncertainty directly drove up crude oil prices, subsequently triggering concerns about a global economic slowdown and rising manufacturing costs. Affected by this sentiment fluctuation, LME copper , after reaching a three-week high on Wednesday, experienced a significant technical pullback today, reversing its gains and falling, as market risk aversion intensified.

Meanwhile, although Shanghai copper showed some resilience at the opening, even touching its highest point since late March, its upward momentum weakened due to the drag from weakening overseas markets and profit-taking pressure from long positions, entering a period of high-level fluctuation. From a macroeconomic perspective, unexpected jumps in energy costs often squeeze the profit margins of downstream processing companies. Given the current fragile recovery in global manufacturing, this significantly suppresses copper prices, a leading industrial commodity. While the medium- to long-term demand driven by the clean energy transition and data center expansion remains a core factor supporting prices according to well-known institutions , high short-term inventory levels and geopolitical factors leading to revised economic outlooks have undoubtedly become the core contradictions dominating the market.
From a fundamental perspective, the physical support of the global copper market is facing severe challenges. As of April 8th, LME copper inventories had climbed to 385,275 tons, a new high since March 2018. This large visible inventory base has become a key supporting factor for the short-selling counterattack, reflecting that although forward demand expectations are positive, the spot market's purchasing power has not yet fully absorbed the existing supply increase. Furthermore, fluctuations in macroeconomic policies cannot be ignored. Recent tariff-related comments have, to some extent, suppressed market risk appetite, and investors' concerns about future trade liquidity have led to increasingly cautious trading near the 10,000-point high.
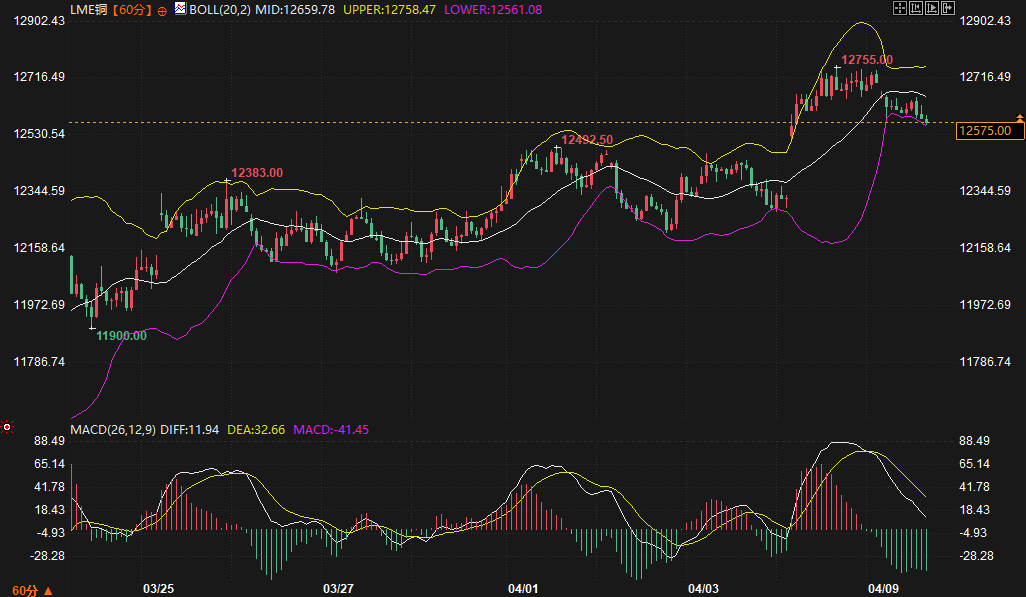
From a technical perspective, LME copper's performance on the 60-minute chart shows a clear topping and pullback pattern. After reaching a high of 12755.00 on April 7th, the downward slope has been steep, and the current price is around 12575.00. Looking at the indicators, the Bollinger Band middle line at 12659.78 has been breached, and the price is approaching the lower band support at 12561.08. More importantly, the MACD indicator has shown a clear death cross signal, with the DIFF line crossing below the DEA line and the green bars continuing to expand, indicating that bearish momentum is accelerating. Since the price has broken below the important support level of 12530.00, the short-term trend correction pressure is extremely high, and there is a risk of further downward movement in the market center.
Compared to the downward trend in overseas markets, the Shanghai copper futures contract has shown stronger lag and resilience. Currently, Shanghai copper is trading at 97,810.00 yuan/ton. Although it has retreated somewhat from the recent rebound high of 98,500.00 yuan/ton, it remains above the Bollinger Band middle line at 97,245.00. While the MACD histogram has narrowed, indicating waning bullish momentum, the DIFF line remains above the DEA line, and a death cross has not yet formed. This "weak overseas, strong domestic" pattern is mainly due to the inertial support of the domestic market for the rebound channel. However, with the breakdown of the LME copper technical pattern, whether Shanghai copper can independently hold the middle line support around 97,200 yuan/ton will be crucial in determining whether the short-term trend will reverse.
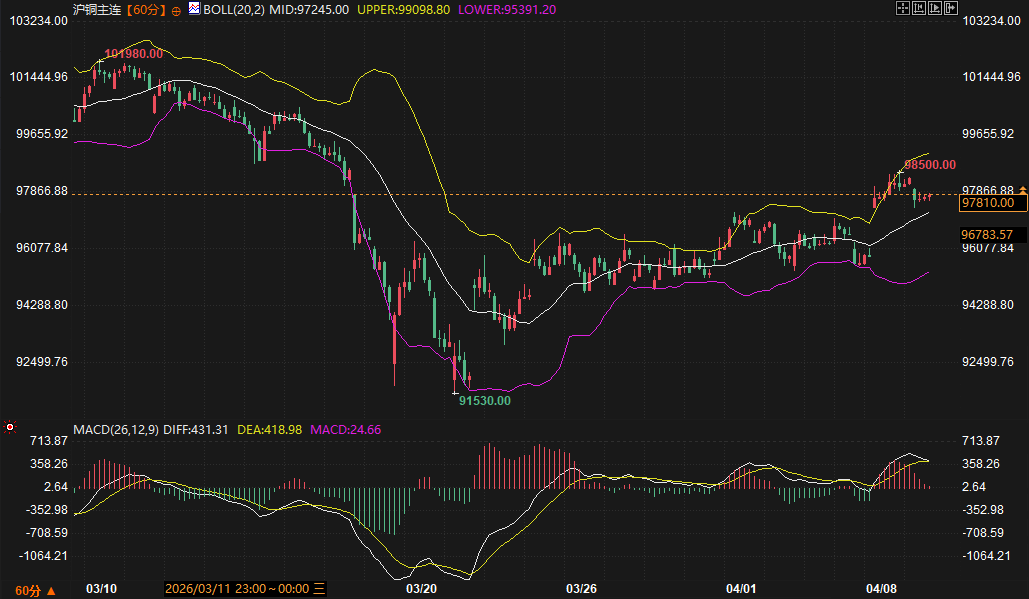
Looking ahead, copper price movements will be highly dependent on the dynamic interplay between energy price trends and geopolitical tensions. If geopolitical tensions lead to sustained high oil prices, manufacturing cost pressures will translate into substantial demand suppression, potentially causing copper prices to enter a deeper correction. Currently, the support range for LME copper is between 12383.00 and 12492.50. If this range fails to hold, the strength of the support at the late March low of 11900.00 should be monitored. Resistance is concentrated around the Bollinger Band middle line at 12660.00. For SHFE copper , the 97245.00 level (Bollinger Band middle line) should be closely watched in the short term. A break below this level could signal the end of the rebound, with support around 95391.00 and resistance between 98500.00 and 99100.00.
Question 1: Why did the rise in crude oil prices lead to a fall in copper prices? What is the logical connection between the two?
In the current macroeconomic context, the rise in crude oil prices is not due to a recovery in demand, but rather driven by supply concerns stemming from geopolitical tensions. This cost-driven surge in oil prices is interpreted by the market as an "energy shock." It not only increases the operating costs of global manufacturing but also triggers fears of rising inflation and a further slowdown in global economic growth. When economic growth expectations are threatened, copper, as the industrial metal most sensitive to macroeconomic conditions, is among the first to see its demand expectations revised. Furthermore, rising risk aversion prompts funds to flow from high-risk assets such as commodities to safe-haven currencies, thus directly suppressing copper prices.
Question 2: Given that well-known institutions predict that the energy transition and data centers will lead to increased demand, why is LME inventory currently at a new high since 2018?
This is a classic example of a misalignment between expectations and reality. Long-term demand (such as energy transition and AI infrastructure) is the underlying logic, determining the upward trend in copper prices. However, inventories reflect the current supply and demand situation in the physical market. LME inventories reached over 385,000 tons in early April, indicating that the current rate of supply release or inventory digestion is temporarily exceeding spot demand. This may be partly due to the fact that the restocking cycle in some global manufacturing regions has not yet fully commenced, and partly due to the fact that physical consumption has been somewhat suppressed at current high price levels, leading to a continuous accumulation of visible inventories.
Question 3: From a technical perspective, where does the current divergence between LME copper and SHFE copper lie?
The main divergence lies in the distinction between "breakout and consolidation." LME copper has shown a clear MACD death cross on the 60-minute chart, and the price has broken below the Bollinger Band middle line and the key support level of 12530, technically indicating a pullback after a short-term peak. While SHFE copper has also been dragged down, its price remains above the Bollinger Band middle line, and the MACD has not yet formed a death cross, showing more of a high-level consolidation within the 97800-98500 range. This divergence suggests that the domestic market's support for copper prices is stronger than that of overseas markets. However, if the overseas market continues to weaken, the downward pressure on SHFE copper to find support will significantly increase.
Question 4: What specific impact did the "tariff remarks" mentioned in the material have on the market?
While these remarks have not yet translated into final trade actions, as a highly uncertain risk factor, they significantly dampen market risk appetite. In copper trading, investors often pre-trade such expectations, leading to a more conservative approach. These comments have sparked concerns about future disruptions to global trade liquidity, weakening the confidence of speculative bulls. Consequently, with copper prices at historically high levels, there is a lack of sufficient follow-up capital to propel prices higher than resistance levels, making it easier for profit-taking to occur.
Question 5: How will the subsequent developments in the situation affect short-term copper pricing through fundamentals?
The impact of the Russia-Ukraine situation on copper prices is primarily transmitted through two dimensions: first, the stability of the energy supply chain. Fluctuations in the situation directly affect the natural gas and crude oil markets, thereby influencing the electricity costs and production plans of European copper refineries; second, the premium of market risk aversion. Although direct physical trade flows may have already been adjusted, any escalation of tensions will lead to increased volatility in financial markets, prompting capital outflows from commodity positions. Currently, the market is highly sensitive to this situation, and any slight disturbance will quickly be reflected in market volatility, putting the effectiveness of technical support levels to the test.
Meanwhile, although Shanghai copper showed some resilience at the opening, even touching its highest point since late March, its upward momentum weakened due to the drag from weakening overseas markets and profit-taking pressure from long positions, entering a period of high-level fluctuation. From a macroeconomic perspective, unexpected jumps in energy costs often squeeze the profit margins of downstream processing companies. Given the current fragile recovery in global manufacturing, this significantly suppresses copper prices, a leading industrial commodity. While the medium- to long-term demand driven by the clean energy transition and data center expansion remains a core factor supporting prices according to well-known institutions , high short-term inventory levels and geopolitical factors leading to revised economic outlooks have undoubtedly become the core contradictions dominating the market.
From a fundamental perspective, the physical support of the global copper market is facing severe challenges. As of April 8th, LME copper inventories had climbed to 385,275 tons, a new high since March 2018. This large visible inventory base has become a key supporting factor for the short-selling counterattack, reflecting that although forward demand expectations are positive, the spot market's purchasing power has not yet fully absorbed the existing supply increase. Furthermore, fluctuations in macroeconomic policies cannot be ignored. Recent tariff-related comments have, to some extent, suppressed market risk appetite, and investors' concerns about future trade liquidity have led to increasingly cautious trading near the 10,000-point high.
From a technical perspective, LME copper's performance on the 60-minute chart shows a clear topping and pullback pattern. After reaching a high of 12755.00 on April 7th, the downward slope has been steep, and the current price is around 12575.00. Looking at the indicators, the Bollinger Band middle line at 12659.78 has been breached, and the price is approaching the lower band support at 12561.08. More importantly, the MACD indicator has shown a clear death cross signal, with the DIFF line crossing below the DEA line and the green bars continuing to expand, indicating that bearish momentum is accelerating. Since the price has broken below the important support level of 12530.00, the short-term trend correction pressure is extremely high, and there is a risk of further downward movement in the market center.
Compared to the downward trend in overseas markets, the Shanghai copper futures contract has shown stronger lag and resilience. Currently, Shanghai copper is trading at 97,810.00 yuan/ton. Although it has retreated somewhat from the recent rebound high of 98,500.00 yuan/ton, it remains above the Bollinger Band middle line at 97,245.00. While the MACD histogram has narrowed, indicating waning bullish momentum, the DIFF line remains above the DEA line, and a death cross has not yet formed. This "weak overseas, strong domestic" pattern is mainly due to the inertial support of the domestic market for the rebound channel. However, with the breakdown of the LME copper technical pattern, whether Shanghai copper can independently hold the middle line support around 97,200 yuan/ton will be crucial in determining whether the short-term trend will reverse.
Looking ahead, copper price movements will be highly dependent on the dynamic interplay between energy price trends and geopolitical tensions. If geopolitical tensions lead to sustained high oil prices, manufacturing cost pressures will translate into substantial demand suppression, potentially causing copper prices to enter a deeper correction. Currently, the support range for LME copper is between 12383.00 and 12492.50. If this range fails to hold, the strength of the support at the late March low of 11900.00 should be monitored. Resistance is concentrated around the Bollinger Band middle line at 12660.00. For SHFE copper , the 97245.00 level (Bollinger Band middle line) should be closely watched in the short term. A break below this level could signal the end of the rebound, with support around 95391.00 and resistance between 98500.00 and 99100.00.
Frequently Asked Questions
Question 1: Why did the rise in crude oil prices lead to a fall in copper prices? What is the logical connection between the two?
In the current macroeconomic context, the rise in crude oil prices is not due to a recovery in demand, but rather driven by supply concerns stemming from geopolitical tensions. This cost-driven surge in oil prices is interpreted by the market as an "energy shock." It not only increases the operating costs of global manufacturing but also triggers fears of rising inflation and a further slowdown in global economic growth. When economic growth expectations are threatened, copper, as the industrial metal most sensitive to macroeconomic conditions, is among the first to see its demand expectations revised. Furthermore, rising risk aversion prompts funds to flow from high-risk assets such as commodities to safe-haven currencies, thus directly suppressing copper prices.
Question 2: Given that well-known institutions predict that the energy transition and data centers will lead to increased demand, why is LME inventory currently at a new high since 2018?
This is a classic example of a misalignment between expectations and reality. Long-term demand (such as energy transition and AI infrastructure) is the underlying logic, determining the upward trend in copper prices. However, inventories reflect the current supply and demand situation in the physical market. LME inventories reached over 385,000 tons in early April, indicating that the current rate of supply release or inventory digestion is temporarily exceeding spot demand. This may be partly due to the fact that the restocking cycle in some global manufacturing regions has not yet fully commenced, and partly due to the fact that physical consumption has been somewhat suppressed at current high price levels, leading to a continuous accumulation of visible inventories.
Question 3: From a technical perspective, where does the current divergence between LME copper and SHFE copper lie?
The main divergence lies in the distinction between "breakout and consolidation." LME copper has shown a clear MACD death cross on the 60-minute chart, and the price has broken below the Bollinger Band middle line and the key support level of 12530, technically indicating a pullback after a short-term peak. While SHFE copper has also been dragged down, its price remains above the Bollinger Band middle line, and the MACD has not yet formed a death cross, showing more of a high-level consolidation within the 97800-98500 range. This divergence suggests that the domestic market's support for copper prices is stronger than that of overseas markets. However, if the overseas market continues to weaken, the downward pressure on SHFE copper to find support will significantly increase.
Question 4: What specific impact did the "tariff remarks" mentioned in the material have on the market?
While these remarks have not yet translated into final trade actions, as a highly uncertain risk factor, they significantly dampen market risk appetite. In copper trading, investors often pre-trade such expectations, leading to a more conservative approach. These comments have sparked concerns about future disruptions to global trade liquidity, weakening the confidence of speculative bulls. Consequently, with copper prices at historically high levels, there is a lack of sufficient follow-up capital to propel prices higher than resistance levels, making it easier for profit-taking to occur.
Question 5: How will the subsequent developments in the situation affect short-term copper pricing through fundamentals?
The impact of the Russia-Ukraine situation on copper prices is primarily transmitted through two dimensions: first, the stability of the energy supply chain. Fluctuations in the situation directly affect the natural gas and crude oil markets, thereby influencing the electricity costs and production plans of European copper refineries; second, the premium of market risk aversion. Although direct physical trade flows may have already been adjusted, any escalation of tensions will lead to increased volatility in financial markets, prompting capital outflows from commodity positions. Currently, the market is highly sensitive to this situation, and any slight disturbance will quickly be reflected in market volatility, putting the effectiveness of technical support levels to the test.
- Risk Warning and Disclaimer
- The market involves risk, and trading may not be suitable for all investors. This article is for reference only and does not constitute personal investment advice, nor does it take into account certain users’ specific investment objectives, financial situation, or other needs. Any investment decisions made based on this information are at your own risk.