The US dollar is caught in a pincer movement of two risks: range-bound trading or a desperate counterattack?
2026-04-09 19:31:48
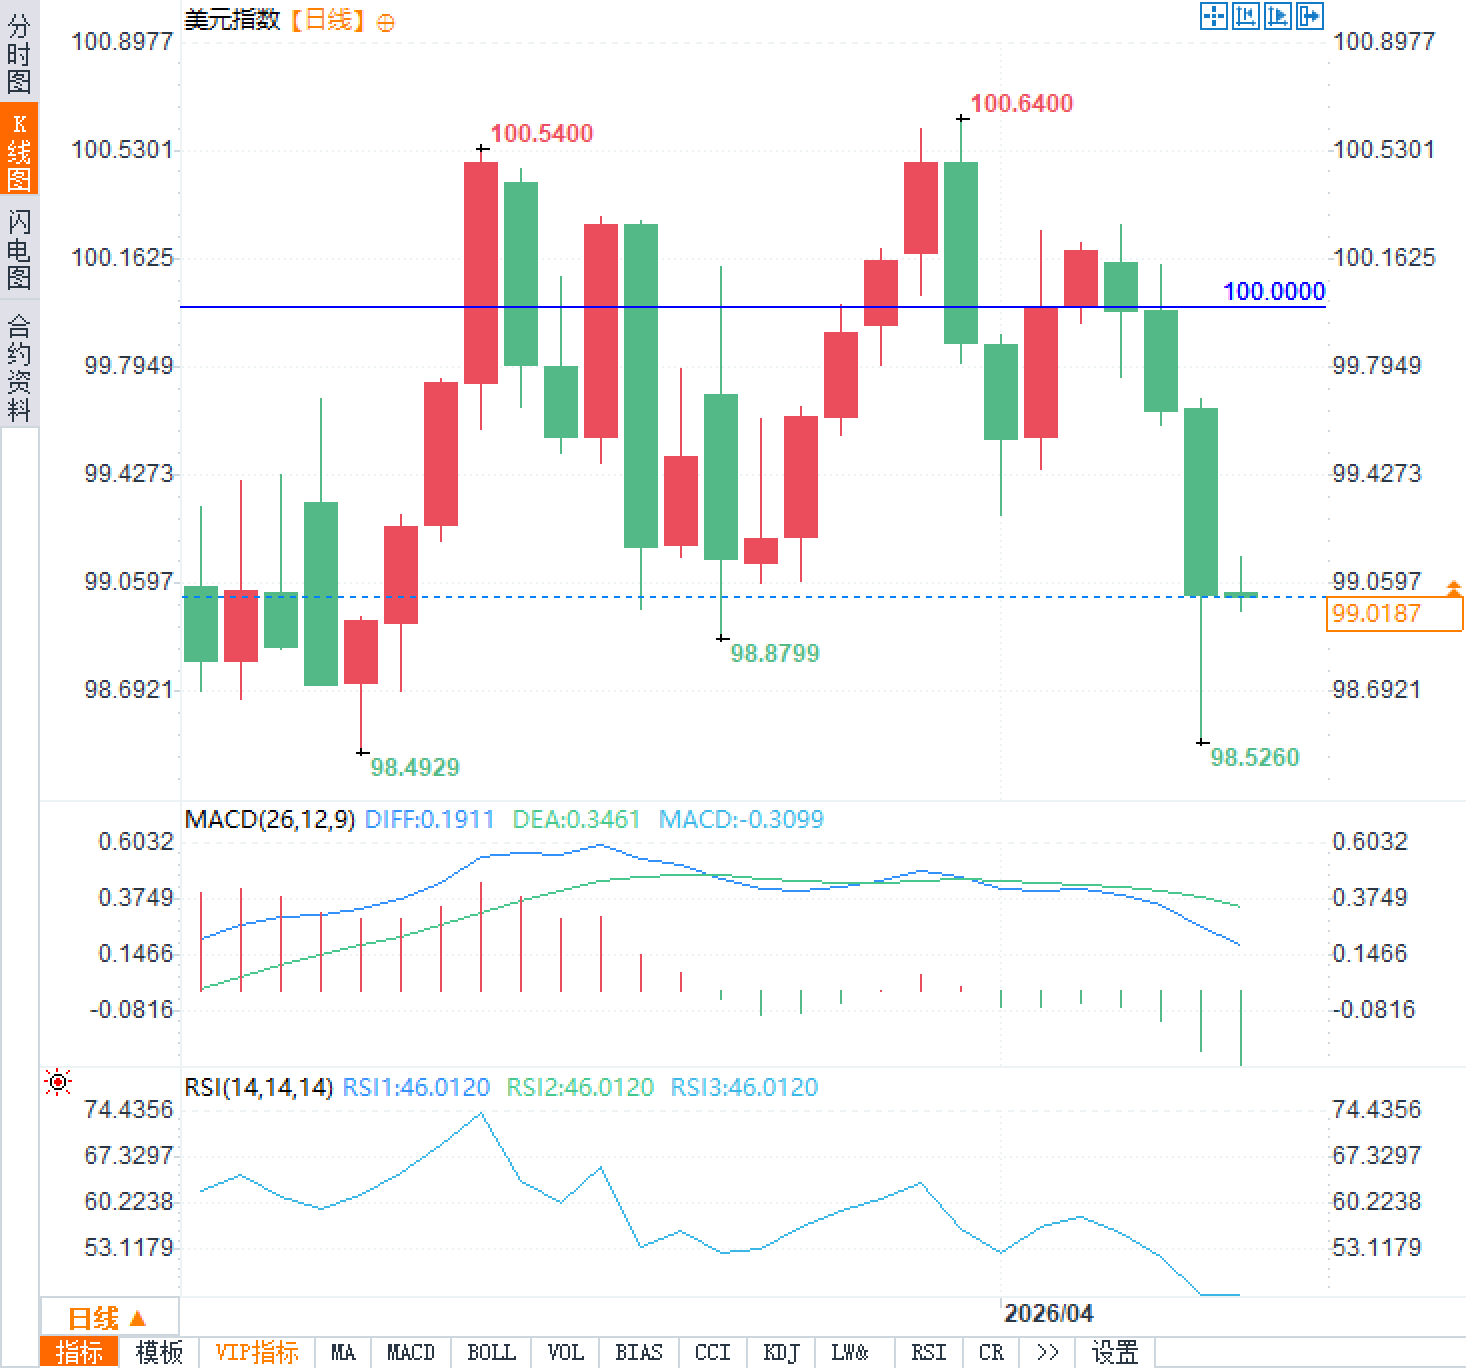
On Thursday, April 9th, the US dollar index fluctuated narrowly around 99, continuing its year-to-date trading range of 96.00 to 100.00. Brent crude oil prices rebounded above $97 per barrel, with a cumulative increase of over 8% from recent lows, driving up energy-related assets. However, the previous gains in the stock and bond markets clearly stalled, while the US dollar index saw a technical rebound after touching its 200-day moving average.
Market focus remains on the continued anchoring effect of interest rate differentials and the potential disruption to inflation expectations from geopolitical energy shocks. The Federal Reserve maintained its target range for the federal funds rate at 3.5% to 3.75% at its March meeting, and the dot plot still indicates an expectation of only one 25-basis-point rate cut in 2026. With the February personal consumption expenditures price index (PCE) data due soon, it is unlikely to significantly alter market pricing of the policy path.

Interest rate differentials remain the core constraint on the dollar index's movement. Even with short-term geopolitical volatility, the relative levels of policy rates in major economies keep the dollar index firmly within the 96-100 range. Currently, the Federal Reserve's policy rate is between 3.5% and 3.75%, roughly in line with the Bank of England's 3.75%, while the European Central Bank's deposit rate remains around 2.0%, and the Swiss National Bank and the Bank of Japan have even lower policy rates. This difference provides both downward support for the dollar and limits its upward potential, as tightening expectations in other major currencies have not yet been fully priced in. Elias Haddad, an analyst at Brown Brothers Harriman, recently pointed out that interest rate differentials continue to anchor the dollar index within this range, and even a rebound in energy prices is unlikely to break this pattern.
Brent crude oil rebounded more than 8% from a low near $90.40 per barrel, directly testing the Federal Reserve's tolerance for inflation. Energy shocks could push up overall price levels, especially given the uncertain future of the Middle East situation and the lingering risk of supply chain disruptions. Haddad emphasized that continued high energy prices would amplify financial instability risks, providing short-term support for the safe-haven dollar. However, if the energy shock gradually subsides, the Fed's policy focus will return to supporting the labor market. The FOMC March meeting minutes showed that most participants were concerned that a prolonged conflict might require additional interest rate cuts to stabilize employment, while some members preferred to control inflation through rate hikes. This two-way risk makes the policy path highly data-dependent, with traders closely monitoring the transmission path between energy prices and core inflation. While energy prices have rebounded, they have not yet broken through the key psychological level of $120 per barrel, and the probability of a second wave of inflation remains under control. The dollar index is therefore fluctuating between risk aversion and policy expectations, with limited short-term rebound strength.
February's PCE data is about to be released, with the market expecting overall PCE to remain at 2.8% year-on-year, and core PCE to slightly decline to 3.0% year-on-year. January's actual data already showed overall PCE at 2.8% year-on-year, slightly lower than the previous month's 2.9%, with real personal consumption expenditure expected to increase by 0.2% month-on-month. The FOMC's March dot plot maintained its median expectation of one 25 basis point rate cut in 2026, with the median federal funds rate at the end of 2026 projected to be around 3.375%, largely in line with market pricing. Haddad believes that this PCE data is unlikely to significantly change rate cut expectations, as it mainly reflects the background before the energy shock. Traders need to pay attention to the actual spending data's validation of consumption resilience; if consumption is stronger than expected, the probability of a rate cut will further decline. Below is a brief comparison of recent PCE data:
Data indicates that inflation is declining slowly, and the Federal Reserve is maintaining a cautious stance, thus the dollar index lacks a catalyst for a one-sided downward trend.
Market focus remains on the continued anchoring effect of interest rate differentials and the potential disruption to inflation expectations from geopolitical energy shocks. The Federal Reserve maintained its target range for the federal funds rate at 3.5% to 3.75% at its March meeting, and the dot plot still indicates an expectation of only one 25-basis-point rate cut in 2026. With the February personal consumption expenditures price index (PCE) data due soon, it is unlikely to significantly alter market pricing of the policy path.
Interest rate differentials dominate the movement of the US dollar index.
Interest rate differentials remain the core constraint on the dollar index's movement. Even with short-term geopolitical volatility, the relative levels of policy rates in major economies keep the dollar index firmly within the 96-100 range. Currently, the Federal Reserve's policy rate is between 3.5% and 3.75%, roughly in line with the Bank of England's 3.75%, while the European Central Bank's deposit rate remains around 2.0%, and the Swiss National Bank and the Bank of Japan have even lower policy rates. This difference provides both downward support for the dollar and limits its upward potential, as tightening expectations in other major currencies have not yet been fully priced in. Elias Haddad, an analyst at Brown Brothers Harriman, recently pointed out that interest rate differentials continue to anchor the dollar index within this range, and even a rebound in energy prices is unlikely to break this pattern.
Energy price rebound and the two-way policy risks of the Federal Reserve
Brent crude oil rebounded more than 8% from a low near $90.40 per barrel, directly testing the Federal Reserve's tolerance for inflation. Energy shocks could push up overall price levels, especially given the uncertain future of the Middle East situation and the lingering risk of supply chain disruptions. Haddad emphasized that continued high energy prices would amplify financial instability risks, providing short-term support for the safe-haven dollar. However, if the energy shock gradually subsides, the Fed's policy focus will return to supporting the labor market. The FOMC March meeting minutes showed that most participants were concerned that a prolonged conflict might require additional interest rate cuts to stabilize employment, while some members preferred to control inflation through rate hikes. This two-way risk makes the policy path highly data-dependent, with traders closely monitoring the transmission path between energy prices and core inflation. While energy prices have rebounded, they have not yet broken through the key psychological level of $120 per barrel, and the probability of a second wave of inflation remains under control. The dollar index is therefore fluctuating between risk aversion and policy expectations, with limited short-term rebound strength.
Inflation data and expectations for the Fed's interest rate cut path
February's PCE data is about to be released, with the market expecting overall PCE to remain at 2.8% year-on-year, and core PCE to slightly decline to 3.0% year-on-year. January's actual data already showed overall PCE at 2.8% year-on-year, slightly lower than the previous month's 2.9%, with real personal consumption expenditure expected to increase by 0.2% month-on-month. The FOMC's March dot plot maintained its median expectation of one 25 basis point rate cut in 2026, with the median federal funds rate at the end of 2026 projected to be around 3.375%, largely in line with market pricing. Haddad believes that this PCE data is unlikely to significantly change rate cut expectations, as it mainly reflects the background before the energy shock. Traders need to pay attention to the actual spending data's validation of consumption resilience; if consumption is stronger than expected, the probability of a rate cut will further decline. Below is a brief comparison of recent PCE data:
| period | Overall PCE year-on-year | Core PCE year-on-year |
|---|---|---|
| December 2025 | 2.9% | 3.1% |
| January 2026 | 2.8% | 3.1% |
| February 2026 forecast | 2.8% | 3.0% |
Frequently Asked Questions
Question 1: Why has the US dollar index been anchored in the 96 to 100 range for so long?
A: This is mainly due to the continued anchoring of interest rate differentials among major economies. The Federal Reserve's policy rate remains advantageous relative to the European Central Bank and the Bank of Japan, limiting the downside potential of the US dollar index. While the energy shock provides short-term safe-haven support, structural factors such as concerns about fiscal sustainability weaken the long-term trend, making a range-bound trading pattern the current dominant characteristic.
Question 2: How will the rebound in energy prices affect the Fed's interest rate cut path?
A: The rebound in energy prices from their lows by more than 8% has directly raised inflation expectations and amplified the two-way risks for the FOMC. The meeting minutes showed that some members were concerned about a prolonged conflict necessitating interest rate cuts to support employment, while others favored rate hikes to control inflation. If the energy shock gradually subsides, the expectation of a 25 basis point rate cut may still materialize; conversely, the probability of a rate cut will decline. Traders need to closely observe the correlation between PCE data and oil prices to avoid making judgments based on a single event.
- Risk Warning and Disclaimer
- The market involves risk, and trading may not be suitable for all investors. This article is for reference only and does not constitute personal investment advice, nor does it take into account certain users’ specific investment objectives, financial situation, or other needs. Any investment decisions made based on this information are at your own risk.