Are US Treasury bonds and the US dollar about to break through key support levels? After gold climbed above 4764, these three events will determine its direction next week.
2026-04-10 20:20:50
On Friday (April 10), global financial markets exhibited significant volatility amid complex geopolitical maneuvering and a restructuring of inflation expectations. The core focus of the trading day was the upcoming negotiations between the US and Iran regarding a long-term ceasefire agreement, an expectation that eased extreme risk aversion in the market in the short term. Boosted by this, global equity assets generally rose, with US stock index futures performing steadily, and major Asian and European stock indices also recording gains.
However, the fragility of the geopolitical situation continues to constrain a full return of risk appetite. Due to recent Israeli actions against Lebanon and restrictions on navigation in the Strait of Hormuz, crude oil prices rebounded after a sharp decline at the beginning of the week, creating new uncertainties for inflation expectations and the path of monetary policy. Against this backdrop, US Treasury yields and the US dollar index remained weak and volatile, while spot gold retreated slightly after reaching a weekly high. However, as the market reprices the probability of a Fed rate cut this year, gold is still expected to record its third consecutive weekly gain.

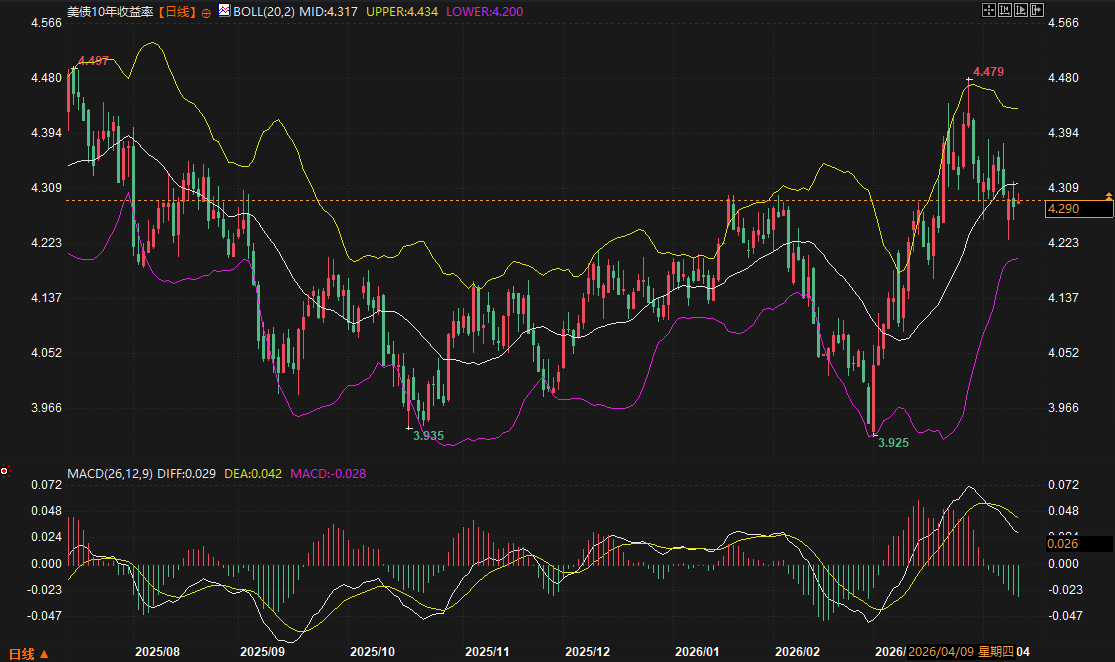
Recently, the yield on 10-year US Treasury bonds has exhibited a typical "rise and fall" pattern. From a technical perspective, the current yield is hovering around 4.290% , trading below the Bollinger Band's middle line at 4.317%. The MACD indicator shows that the DIFF line has crossed below the DEA line, forming a "death cross," and the green bars continue to expand, indicating that yields will still face some downward pressure in the short term.
On the fundamental front, although March inflation data is about to be released, and the market is concerned that it may reflect cost-push pressures from the previous situation, the progress of the ceasefire agreement has significantly suppressed long-term inflation premiums. Currently, the support range for 10-year US Treasury yields is locked at 4.200% (lower Bollinger Band) to 4.250% . If substantial positive news emerges from next week's negotiations, yields may further approach the 4.000% level; conversely, if the situation in the Middle East recurs, there is strong resistance around 4.434% (upper Bollinger Band) . Due to the frequent switching of funds between safe-haven and risk assets, volatility in the US Treasury market is expected to remain high during next week's settlement period.
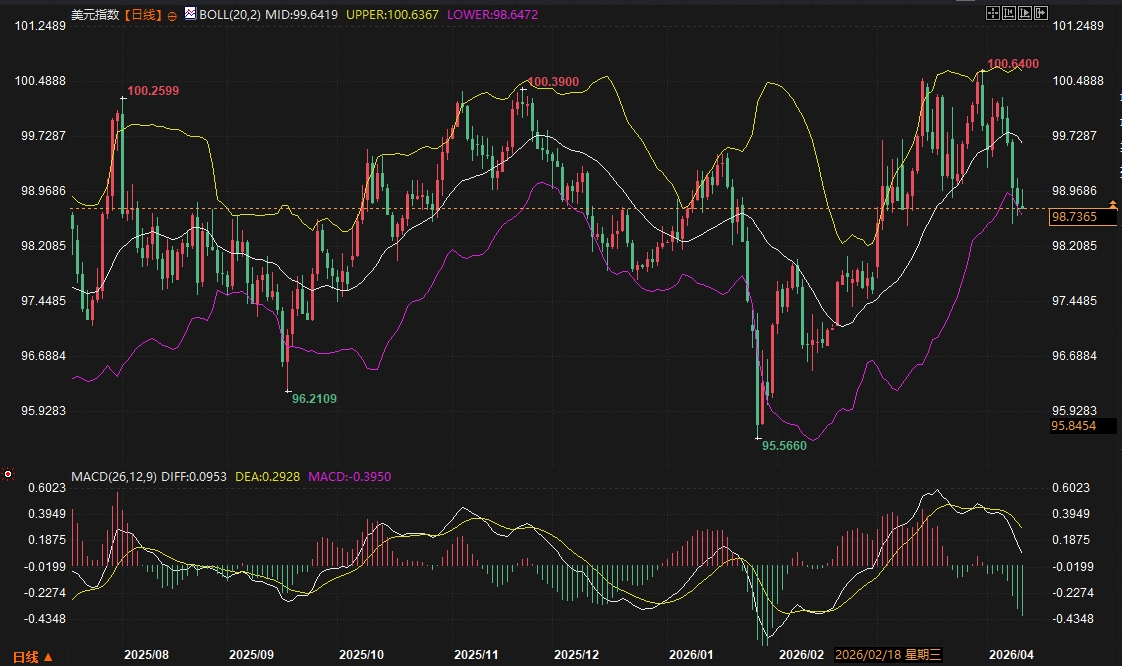
The US dollar index has been weak recently, currently trading at 98.7365 , having broken below the Bollinger Band middle line at 99.6419 and approaching the lower band support level at 98.6472. The MACD indicator shows a death cross, with the green bars expanding, indicating that bears are in control. This trend reflects the market's digestion of the impact of tariff comments and a decline in the dollar's appeal as a safe-haven currency amid expectations of easing geopolitical tensions.
In the short term, the strength of the US dollar largely depends on interest rate differentials between the US and Germany, and between the US and the UK. Given that Germany's March CPI rose to 2.8%, the European Central Bank is likely to maintain a relatively hawkish stance, further limiting the dollar's upside potential. Next week, the key support level for the US dollar index lies in the 98.50 to 98.65 range. If next week's US core CPI data is stronger than expected, the dollar may find some breathing room near the lower Bollinger Band and retest the 99.64 resistance level; otherwise, the dollar may begin a deep retracement towards the February low of 95.56.
Spot gold is currently trading at $ 4764.69 per ounce. Despite a slight discount on Friday due to profit-taking, the weekly uptrend remains intact. On the daily chart, the MACD has formed a golden cross below the zero line with expanding red bars, indicating that short-term upward momentum remains. The price is currently stabilizing above the Bollinger Band middle line at $ 4673.83 , demonstrating strong resilience.
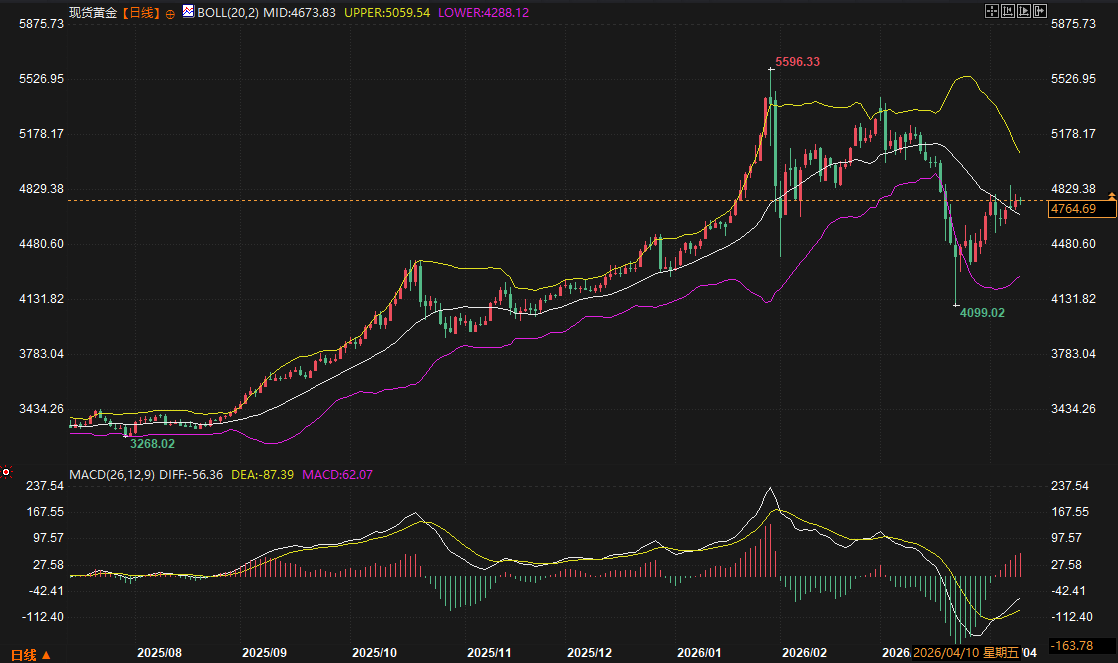
Logically, gold is currently in a hedging phase between the fading geopolitical premium and rising expectations of interest rate cuts. While the decline in oil prices from their highs has reduced the risk of double-dip inflation, it has also reignited market speculation about a Fed rate cut in June or later. Next week, the key resistance zone for gold is between the psychological level of $5000 and $5059.54 (the upper Bollinger Band) . Key support lies near the middle Bollinger Band at $ 4673 . If geopolitical negotiations make a breakthrough, gold may retest the $ 4300 support area due to safe-haven outflows; however, until structural inflationary pressures completely disappear, gold's value as a long-term asset allocation remains solid.
Looking ahead to next week, the market will enter a period of logical confirmation regarding the "post-negotiation era." As the US dollar index and US Treasury yields are trending downwards in tandem, the pricing environment for commodities, especially gold, is relatively relaxed. If the international dialogue over the weekend reaches a preliminary framework, the market focus will quickly shift to economic fundamentals. At that time, US consumer data and employment forecasts will become the core drivers guiding the dollar's recovery or the continuation of gold's rebound.
From a technical perspective, gold has broken out of the deep, one-sided downward trend that began in early 2026 and entered a period of wide-range consolidation and bottoming. Next week, the risk of a trend reversal due to the narrowing of the Bollinger Bands should be noted. Given the interplay of multiple geopolitical and macroeconomic variables, it is advisable to closely observe the trading volume of major assets at support levels and be wary of market sentiment reversals caused by a single unexpected geopolitical event.
1. Why did gold prices not surge today despite the decline in US Treasury yields?
A: Although US Treasury yields are traditionally negatively correlated with gold, today's gold price movement was mainly influenced by a decline in the safe-haven premium due to easing geopolitical tensions. Furthermore, given the previous days of gains in gold, some long positions opted to take profits ahead of weekend negotiations, and this technical pullback offset the support from the falling yields.
2. What direct impact will the ceasefire agreement negotiations have on the US dollar index?
A: If the negotiations are successful, it will reduce global uncertainty, leading to safe-haven outflows from US Treasuries and the US dollar. At the same time, reduced geopolitical risks will help lower energy costs and alleviate inflationary pressures, thereby strengthening market expectations for a Federal Reserve rate cut, which typically puts downward pressure on the US dollar.
3. Have the technical signals for gold shifted from bearish to bullish?
A: Gold is currently in a "rebound and correction" phase. Although the MACD golden cross and expanding red bars indicate strong short-term rebound momentum, and the price has risen above the Bollinger Band middle line, there is still considerable room for further decline before reaching the January high. It is more likely that this is an upward phase within a wide-range fluctuation, rather than a complete confirmation of a long-term, one-sided bullish trend.
4. Why did crude oil prices rebound despite expectations of a ceasefire?
A: The rebound was mainly due to supply-side disruptions, particularly the recent unforeseen events involving Saudi energy facilities that led to production declines, coupled with the lingering risks of navigation through the Strait of Hormuz. The market believes that even if a ceasefire is reached, the energy supply chain will take time to recover, and these supply concerns have temporarily outweighed the negative impact of an agreement expectation.
5. What are the most important macroeconomic indicators for the market to watch next week?
A: Besides the ongoing US-Iran negotiations, the most crucial data releases next Monday, including the quarterly financial reports from major institutions and the US core CPI data, will be the most important. These data will directly reveal the actual impact of the current situation on corporate profits and inflation, thereby revising the market's probability pricing of the Federal Reserve's future interest rate decisions.
However, the fragility of the geopolitical situation continues to constrain a full return of risk appetite. Due to recent Israeli actions against Lebanon and restrictions on navigation in the Strait of Hormuz, crude oil prices rebounded after a sharp decline at the beginning of the week, creating new uncertainties for inflation expectations and the path of monetary policy. Against this backdrop, US Treasury yields and the US dollar index remained weak and volatile, while spot gold retreated slightly after reaching a weekly high. However, as the market reprices the probability of a Fed rate cut this year, gold is still expected to record its third consecutive weekly gain.
US Treasury yield trends under risk aversion and policy maneuvering
Recently, the yield on 10-year US Treasury bonds has exhibited a typical "rise and fall" pattern. From a technical perspective, the current yield is hovering around 4.290% , trading below the Bollinger Band's middle line at 4.317%. The MACD indicator shows that the DIFF line has crossed below the DEA line, forming a "death cross," and the green bars continue to expand, indicating that yields will still face some downward pressure in the short term.
On the fundamental front, although March inflation data is about to be released, and the market is concerned that it may reflect cost-push pressures from the previous situation, the progress of the ceasefire agreement has significantly suppressed long-term inflation premiums. Currently, the support range for 10-year US Treasury yields is locked at 4.200% (lower Bollinger Band) to 4.250% . If substantial positive news emerges from next week's negotiations, yields may further approach the 4.000% level; conversely, if the situation in the Middle East recurs, there is strong resistance around 4.434% (upper Bollinger Band) . Due to the frequent switching of funds between safe-haven and risk assets, volatility in the US Treasury market is expected to remain high during next week's settlement period.
US Dollar Index: Downside Risks After Technical Breakdown
The US dollar index has been weak recently, currently trading at 98.7365 , having broken below the Bollinger Band middle line at 99.6419 and approaching the lower band support level at 98.6472. The MACD indicator shows a death cross, with the green bars expanding, indicating that bears are in control. This trend reflects the market's digestion of the impact of tariff comments and a decline in the dollar's appeal as a safe-haven currency amid expectations of easing geopolitical tensions.
In the short term, the strength of the US dollar largely depends on interest rate differentials between the US and Germany, and between the US and the UK. Given that Germany's March CPI rose to 2.8%, the European Central Bank is likely to maintain a relatively hawkish stance, further limiting the dollar's upside potential. Next week, the key support level for the US dollar index lies in the 98.50 to 98.65 range. If next week's US core CPI data is stronger than expected, the dollar may find some breathing room near the lower Bollinger Band and retest the 99.64 resistance level; otherwise, the dollar may begin a deep retracement towards the February low of 95.56.
Spot Gold: Balancing Trend Correction and Inflation Hedging
Spot gold is currently trading at $ 4764.69 per ounce. Despite a slight discount on Friday due to profit-taking, the weekly uptrend remains intact. On the daily chart, the MACD has formed a golden cross below the zero line with expanding red bars, indicating that short-term upward momentum remains. The price is currently stabilizing above the Bollinger Band middle line at $ 4673.83 , demonstrating strong resilience.
Logically, gold is currently in a hedging phase between the fading geopolitical premium and rising expectations of interest rate cuts. While the decline in oil prices from their highs has reduced the risk of double-dip inflation, it has also reignited market speculation about a Fed rate cut in June or later. Next week, the key resistance zone for gold is between the psychological level of $5000 and $5059.54 (the upper Bollinger Band) . Key support lies near the middle Bollinger Band at $ 4673 . If geopolitical negotiations make a breakthrough, gold may retest the $ 4300 support area due to safe-haven outflows; however, until structural inflationary pressures completely disappear, gold's value as a long-term asset allocation remains solid.
Future Outlook
Looking ahead to next week, the market will enter a period of logical confirmation regarding the "post-negotiation era." As the US dollar index and US Treasury yields are trending downwards in tandem, the pricing environment for commodities, especially gold, is relatively relaxed. If the international dialogue over the weekend reaches a preliminary framework, the market focus will quickly shift to economic fundamentals. At that time, US consumer data and employment forecasts will become the core drivers guiding the dollar's recovery or the continuation of gold's rebound.
From a technical perspective, gold has broken out of the deep, one-sided downward trend that began in early 2026 and entered a period of wide-range consolidation and bottoming. Next week, the risk of a trend reversal due to the narrowing of the Bollinger Bands should be noted. Given the interplay of multiple geopolitical and macroeconomic variables, it is advisable to closely observe the trading volume of major assets at support levels and be wary of market sentiment reversals caused by a single unexpected geopolitical event.
Frequently Asked Questions
1. Why did gold prices not surge today despite the decline in US Treasury yields?
A: Although US Treasury yields are traditionally negatively correlated with gold, today's gold price movement was mainly influenced by a decline in the safe-haven premium due to easing geopolitical tensions. Furthermore, given the previous days of gains in gold, some long positions opted to take profits ahead of weekend negotiations, and this technical pullback offset the support from the falling yields.
2. What direct impact will the ceasefire agreement negotiations have on the US dollar index?
A: If the negotiations are successful, it will reduce global uncertainty, leading to safe-haven outflows from US Treasuries and the US dollar. At the same time, reduced geopolitical risks will help lower energy costs and alleviate inflationary pressures, thereby strengthening market expectations for a Federal Reserve rate cut, which typically puts downward pressure on the US dollar.
3. Have the technical signals for gold shifted from bearish to bullish?
A: Gold is currently in a "rebound and correction" phase. Although the MACD golden cross and expanding red bars indicate strong short-term rebound momentum, and the price has risen above the Bollinger Band middle line, there is still considerable room for further decline before reaching the January high. It is more likely that this is an upward phase within a wide-range fluctuation, rather than a complete confirmation of a long-term, one-sided bullish trend.
4. Why did crude oil prices rebound despite expectations of a ceasefire?
A: The rebound was mainly due to supply-side disruptions, particularly the recent unforeseen events involving Saudi energy facilities that led to production declines, coupled with the lingering risks of navigation through the Strait of Hormuz. The market believes that even if a ceasefire is reached, the energy supply chain will take time to recover, and these supply concerns have temporarily outweighed the negative impact of an agreement expectation.
5. What are the most important macroeconomic indicators for the market to watch next week?
A: Besides the ongoing US-Iran negotiations, the most crucial data releases next Monday, including the quarterly financial reports from major institutions and the US core CPI data, will be the most important. These data will directly reveal the actual impact of the current situation on corporate profits and inflation, thereby revising the market's probability pricing of the Federal Reserve's future interest rate decisions.
- Risk Warning and Disclaimer
- The market involves risk, and trading may not be suitable for all investors. This article is for reference only and does not constitute personal investment advice, nor does it take into account certain users’ specific investment objectives, financial situation, or other needs. Any investment decisions made based on this information are at your own risk.