Gold investors are awaiting further clarification on the US-Iran situation.
2026-04-24 01:29:02
On Thursday (April 23), during the US trading session, the international spot gold price fell slightly, reaching $4,717.5 per ounce, a decrease of 0.43%.
The international gold market has experienced significant volatility in recent weeks, primarily due to traders continuously assessing the short- and medium-term impact of the ongoing conflict between the United States and Iran on the metals market. Currently, the market is generally awaiting further clarification on the US-Iran situation.

The news that US President Trump's announcement of a possible extension of the 10-day ceasefire agreement between Lebanon and Israel (effective April 17) coupled with the decline in Treasury yields from their intraday highs after the release of US initial jobless claims data helped gold recover some of its intraday losses. The expectation of a ceasefire between Lebanon and Israel eased geopolitical tensions, which, in conjunction with the US-Iran situation, indirectly affected the safe-haven demand for gold.
"What's driving market pricing is the earlier indication of a potential breakthrough in the Lebanese ceasefire agreement," said Daniel Galli, commodities strategist at TD Securities. "But this coincides with the release of economic data. Yields and data will certainly play a role, but all asset prices, including gold, will fluctuate based on news headlines (geopolitical news)."
Shipping disruptions in the Strait of Hormuz continue to fuel inflation concerns.
Tensions in the Strait of Hormuz are escalating, and the strait has now been unilaterally and completely blocked by the U.S. Navy (previous statements of a "double blockade" were incorrect; Iran has not implemented a blockade). U.S. President Trump stated on Truth Social, "We have complete control of the Strait of Hormuz, and no ship can enter or leave without the permission of the U.S. Navy." He also claimed to have ordered the Navy to "sink any ship that lays mines in the Strait of Hormuz."
Meanwhile, The Washington Post, citing a Pentagon assessment, reported that clearing landmines from the straits could take up to six months, highlighting the risk of prolonged disruptions to global oil supplies. According to shipping companies and Iran's semi-official news agency Tasnim, the Islamic Revolutionary Guard Corps detained two ships in the strait on Wednesday, April 22, further exacerbating shipping disruptions and directly driving up crude oil prices, thus intensifying global inflation concerns. This makes it more likely that major central banks around the world, such as the Federal Reserve, will maintain high interest rates—although gold is a traditional inflation hedge, rising interest rates will reduce the attractiveness of this non-yielding asset, putting downward pressure on gold prices.
Financial data
Data shows that the number of Americans filing for unemployment benefits last week exceeded expectations, providing some support for gold. For the week ending April 18, seasonally adjusted initial jobless claims rose by 6,000 to 214,000, higher than the 210,000 previously reported by Reuters.
Meanwhile, the preliminary reading of the S&P Global Manufacturing PMI for April rose to 54 from 52.3 in March, reaching its highest level in 47 months; while the preliminary reading of the S&P Global Services PMI for April rose to 51.3 from 49.8, also a two-month high. It should be noted that the 50-point threshold for the PMI index indicates expansion or contraction. Both indices breaking through this threshold (the services PMI returning above the threshold) suggests a continued recovery in the US economy, potentially reinforcing expectations that the Federal Reserve will maintain high interest rates, indirectly putting downward pressure on gold prices.
Technical Analysis
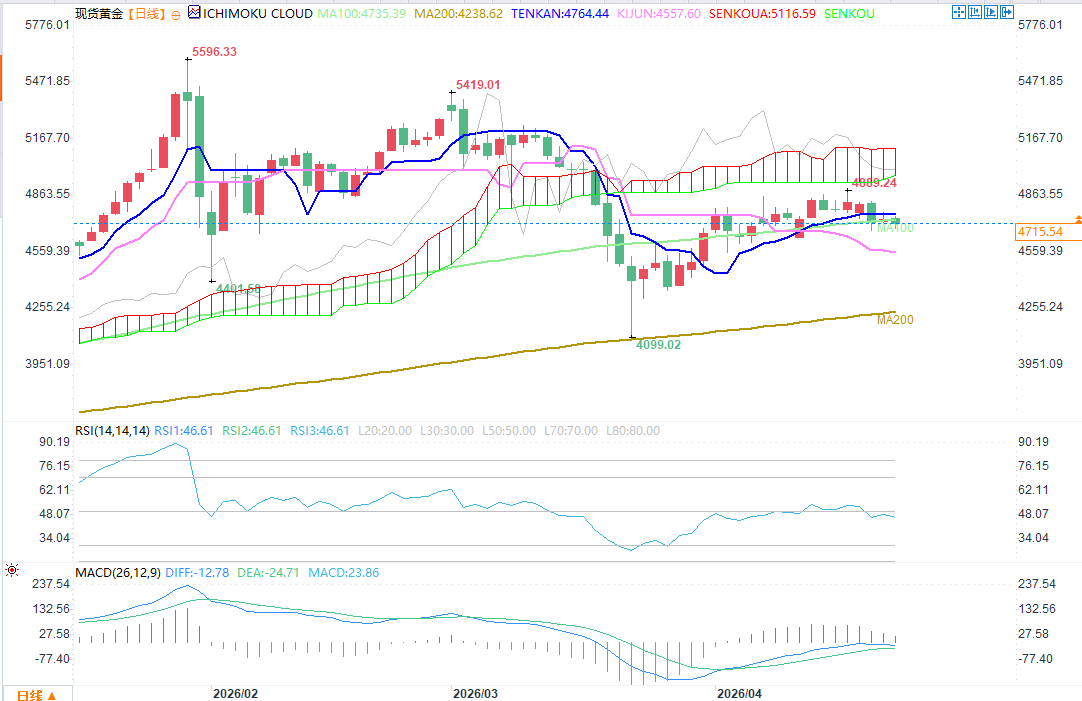
(Spot gold daily chart source: FX678)
In the long term, the 200-day moving average (MA200) continues to rise, and the bull market structure remains intact. In the medium term, the price has risen above the Ichimoku Cloud benchmark, the MACD has formed a golden cross below the zero line with the red bars continuing to expand, and the lagging line has also moved away from below the price, indicating that the previous downward momentum has weakened and a rebound is underway.
Short-term prices are fluctuating around the 100-day moving average (MA100), facing resistance at the conversion line around 4764 (current price is $4717.5/oz, still below this resistance level), and have not yet broken through the strong resistance at 4970, the lower edge of the Ichimoku Cloud. The RSI is in the neutral range, with moderate upward momentum and no immediate risk of overbought pullback.
In terms of trading strategy, after the price stabilizes above the 100-day moving average (MA100) and the conversion line, the rebound target is 4970. If it falls below the baseline of 4557, the rebound trend will end, and we need to be wary of a return to the downward channel, testing the support level of the recent low of 4099.
The international gold market has experienced significant volatility in recent weeks, primarily due to traders continuously assessing the short- and medium-term impact of the ongoing conflict between the United States and Iran on the metals market. Currently, the market is generally awaiting further clarification on the US-Iran situation.
The news that US President Trump's announcement of a possible extension of the 10-day ceasefire agreement between Lebanon and Israel (effective April 17) coupled with the decline in Treasury yields from their intraday highs after the release of US initial jobless claims data helped gold recover some of its intraday losses. The expectation of a ceasefire between Lebanon and Israel eased geopolitical tensions, which, in conjunction with the US-Iran situation, indirectly affected the safe-haven demand for gold.
"What's driving market pricing is the earlier indication of a potential breakthrough in the Lebanese ceasefire agreement," said Daniel Galli, commodities strategist at TD Securities. "But this coincides with the release of economic data. Yields and data will certainly play a role, but all asset prices, including gold, will fluctuate based on news headlines (geopolitical news)."
Shipping disruptions in the Strait of Hormuz continue to fuel inflation concerns.
Tensions in the Strait of Hormuz are escalating, and the strait has now been unilaterally and completely blocked by the U.S. Navy (previous statements of a "double blockade" were incorrect; Iran has not implemented a blockade). U.S. President Trump stated on Truth Social, "We have complete control of the Strait of Hormuz, and no ship can enter or leave without the permission of the U.S. Navy." He also claimed to have ordered the Navy to "sink any ship that lays mines in the Strait of Hormuz."
Meanwhile, The Washington Post, citing a Pentagon assessment, reported that clearing landmines from the straits could take up to six months, highlighting the risk of prolonged disruptions to global oil supplies. According to shipping companies and Iran's semi-official news agency Tasnim, the Islamic Revolutionary Guard Corps detained two ships in the strait on Wednesday, April 22, further exacerbating shipping disruptions and directly driving up crude oil prices, thus intensifying global inflation concerns. This makes it more likely that major central banks around the world, such as the Federal Reserve, will maintain high interest rates—although gold is a traditional inflation hedge, rising interest rates will reduce the attractiveness of this non-yielding asset, putting downward pressure on gold prices.
Financial data
Data shows that the number of Americans filing for unemployment benefits last week exceeded expectations, providing some support for gold. For the week ending April 18, seasonally adjusted initial jobless claims rose by 6,000 to 214,000, higher than the 210,000 previously reported by Reuters.
Meanwhile, the preliminary reading of the S&P Global Manufacturing PMI for April rose to 54 from 52.3 in March, reaching its highest level in 47 months; while the preliminary reading of the S&P Global Services PMI for April rose to 51.3 from 49.8, also a two-month high. It should be noted that the 50-point threshold for the PMI index indicates expansion or contraction. Both indices breaking through this threshold (the services PMI returning above the threshold) suggests a continued recovery in the US economy, potentially reinforcing expectations that the Federal Reserve will maintain high interest rates, indirectly putting downward pressure on gold prices.
Technical Analysis
(Spot gold daily chart source: FX678)
In the long term, the 200-day moving average (MA200) continues to rise, and the bull market structure remains intact. In the medium term, the price has risen above the Ichimoku Cloud benchmark, the MACD has formed a golden cross below the zero line with the red bars continuing to expand, and the lagging line has also moved away from below the price, indicating that the previous downward momentum has weakened and a rebound is underway.
Short-term prices are fluctuating around the 100-day moving average (MA100), facing resistance at the conversion line around 4764 (current price is $4717.5/oz, still below this resistance level), and have not yet broken through the strong resistance at 4970, the lower edge of the Ichimoku Cloud. The RSI is in the neutral range, with moderate upward momentum and no immediate risk of overbought pullback.
In terms of trading strategy, after the price stabilizes above the 100-day moving average (MA100) and the conversion line, the rebound target is 4970. If it falls below the baseline of 4557, the rebound trend will end, and we need to be wary of a return to the downward channel, testing the support level of the recent low of 4099.
- Risk Warning and Disclaimer
- The market involves risk, and trading may not be suitable for all investors. This article is for reference only and does not constitute personal investment advice, nor does it take into account certain users’ specific investment objectives, financial situation, or other needs. Any investment decisions made based on this information are at your own risk.