US Treasury volatility has been pushed to a five-year low, and both gold and the US dollar are awaiting a direction—the countdown to a breakout has begun.
2026-04-27 20:47:52
On Monday (April 27), the global commodities and foreign exchange markets began the new week in a subtle "silence." Although the Russia-Ukraine situation and geopolitical tensions in the Middle East continue to weigh on markets, participants remained generally restrained due to the upcoming Federal Reserve (FOMC) monetary policy meeting later this week. Currently, the 10-year US Treasury yield is essentially unchanged, the US dollar index is hovering at low levels, and spot gold is attempting to stabilize after a pullback from its highs.
Beneath this apparent calm, undercurrents are surging. Analysis from renowned institutions points out that the current Bollinger Band width in the US Treasury market has fallen to a five-year low, and this extreme suppression of volatility often foreshadows a sharp market move. Fundamentally, the market is closely watching potential changes in the leadership of the Federal Reserve. As the process may be accelerated, the logic surrounding the confirmation of the new chairman is reshaping market expectations for the medium- to long-term direction of monetary policy. If there are structural changes in the composition of the Federal Reserve Board of Governors in the coming months, its tolerance for inflation and its control over the interest rate path will become key variables.
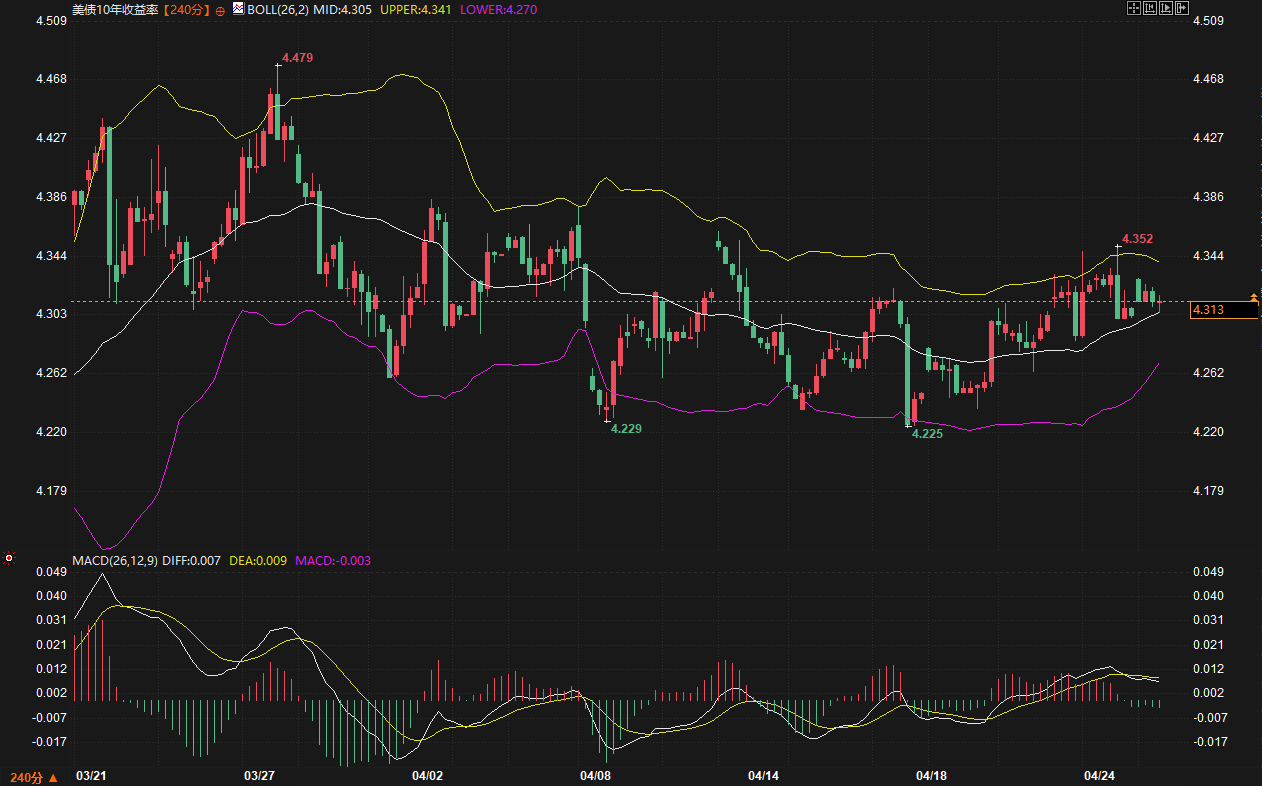
The 10-year US Treasury yield is currently hovering around 4.313% . Looking at the 240-minute chart, the Bollinger Bands are generally flat, with the middle band at 4.305% , and the price is oscillating closely around it. It's worth noting that the current Bollinger Band width is only 0.03, a historically low value suggesting the market is at a critical point of energy accumulation.
From a fundamental perspective, inflationary pressures remain robust as US economic data (such as the Texas manufacturing survey) is expected to show continued growth in production and new orders. Rising inflation expectations from the University of Michigan have further cooled market expectations for interest rate cuts. Technically, the MACD indicator shows the DIFF and DEA lines almost overlapping, with very small green bars, indicating a stalemate between bulls and bears at the 4.300% level.
In the short term, the upside resistance zone is locked at 4.34% - 4.35% . If inflation exceeds expectations or risk aversion subsides, yields may break upwards, even testing the 4.50% level. Conversely, if geopolitical tensions ease substantially, yields may retreat to the support zone of 4.27% - 4.28% . In the current environment, the market is more inclined to "sell on dips" (i.e., push up yields), as strong economic fundamentals provide a floor for yields.
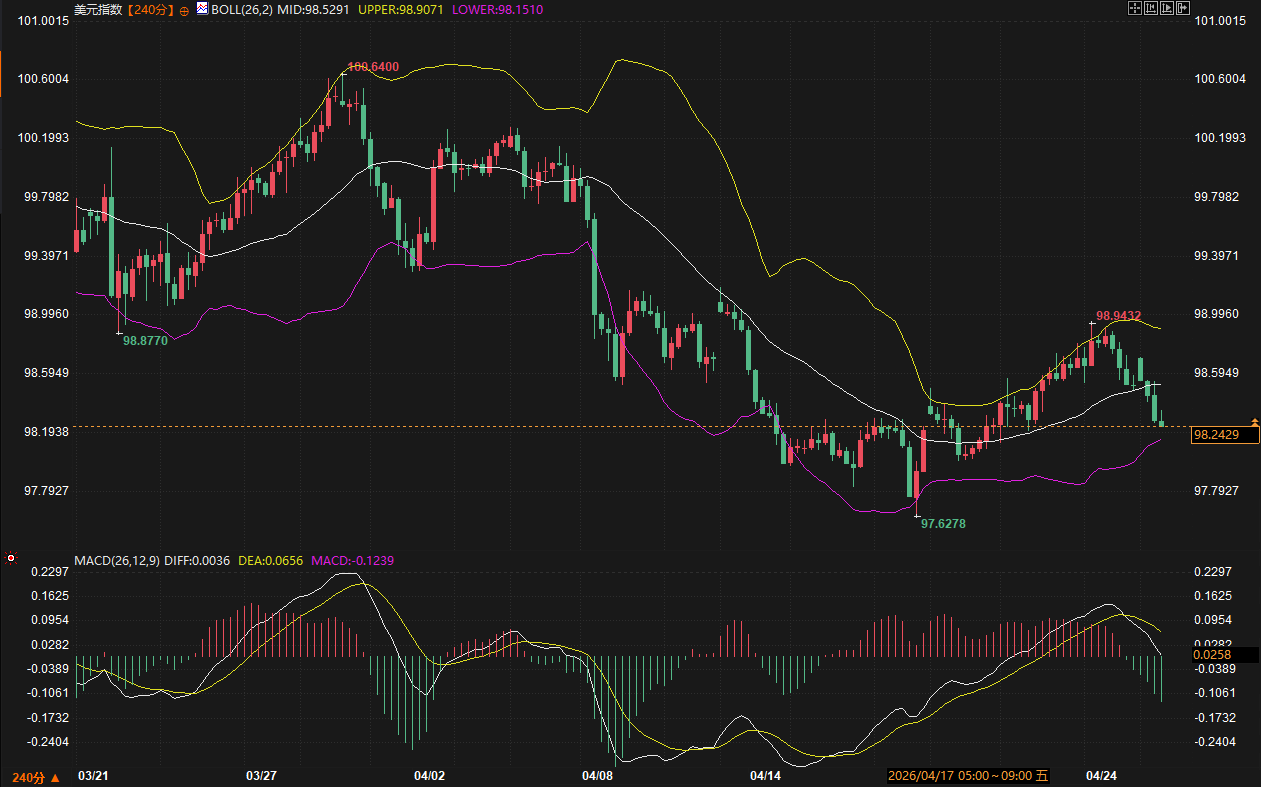
The US dollar index is currently quoted at 98.2429 , showing a clear downward trend. Since reaching a high of 100.64 in early April, the US dollar index has been constrained by the downward-sloping middle Bollinger Band on the 240-minute chart.
The MACD indicator shows that the DIFF line remains below the DEA line, and the green bars are still expanding, indicating that the bearish momentum has not yet been fully released. The price is currently approaching the lower Bollinger Band at 98.15 . If this level is breached, the US dollar index will likely retest the support level near the previous low of 97.62 .
The dollar's weakness stems in part from market concerns about a dovish stance from future Federal Reserve officials. While current officials have reiterated their commitment to combating inflation, the market is repricing long-term policy continuity amid potential power transitions within the Fed. In the short term, 98.53 (the Bollinger Band's middle line) constitutes key resistance; unless this level is effectively recovered, the dollar's upside potential will be severely limited.
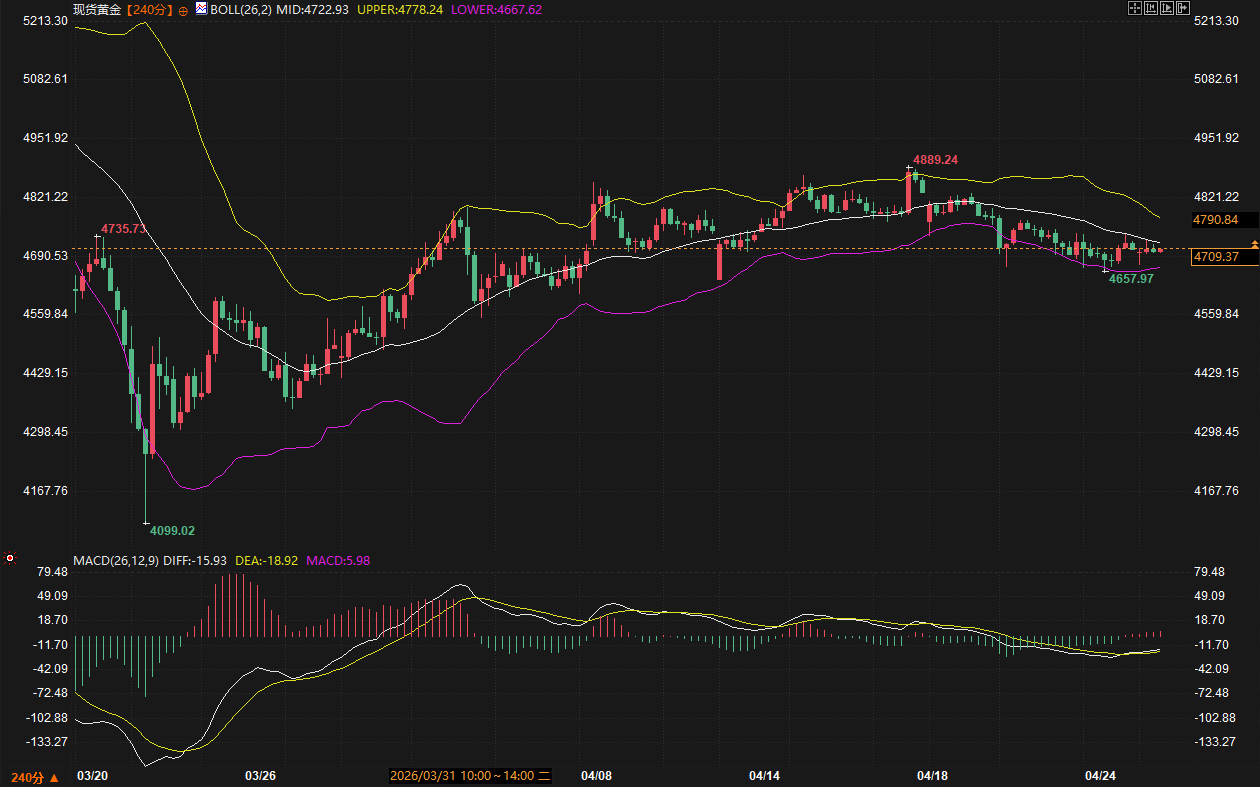
Spot gold is currently priced at $4709.37 . After reaching a high of $ 4889.24 in mid-April, gold prices underwent a significant technical correction. Currently, gold prices are trading below the 240-minute Bollinger Band middle line at $4722.93 , indicating a bottoming phase after the decline.
Technical indicators are showing positive divergence signals. The MACD has formed a golden cross below the zero line (DIFF crossing above DEA), and the red bars are starting to expand slightly, which usually indicates the exhaustion of short-term downward momentum. Although the overall trend has not yet reversed, the need for a rebound is increasing.
In the next 2-3 trading days, gold needs to first challenge the 4723 resistance level. If it successfully breaks through this level, it may then test the 4800 psychological level. The key support zone below is between 4650 and 4660 ; if the geopolitical situation does not deteriorate further, this zone should provide strong support. However, considering the potential upward pressure on US Treasury yields, gold's non-interest-bearing asset status may be somewhat suppressed during any rebound.
In summary, the market is expected to maintain a high volatility prelude over the next 2-3 days. The period of consolidation within an extremely narrow range for US Treasury yields is nearing its end, and directional movement will be heavily influenced by this week's large-scale Treasury bond issuance (such as the auctions of 2-year and 5-year bonds) and manufacturing data.
The US dollar index will remain under pressure in the short term, searching for a bottom within a wide range of 97.62-98.94 . Gold's price movement will be highly dependent on fluctuations in US Treasury real interest rates, with a high probability of a short-term "bottoming out and rebounding," but caution is advised regarding a potential second wave of downward pressure from a rebound in the dollar after hitting key support levels. In terms of trading environment, the market is currently in a "two-way range trading" mode; investors should closely monitor the direction of the Bollinger Bands' expansion to determine the start of a new unilateral trend.
1. Why is it said that US Treasury yields are currently in a "power accumulation" phase?
A: From a technical perspective, the Bollinger Band width for the 10-year US Treasury yield has fallen to a historical low of 0.03. Market experience suggests that extremely narrow bands represent long-term suppression of volatility, often foreshadowing a subsequent explosive market movement. Given the current strong US economy, rising inflation expectations, and personnel changes at the Federal Reserve, this "calm" is highly susceptible to being disrupted by data or policy signals, potentially leading to a significant breakdown in yields.
2. What substantive impact do rumors of personnel changes within the Federal Reserve have on the market?
A: The market is focused on the selection of the new chairman and the change of members of the Board of Governors, with the core logic being the continuity of policy and the tolerance for inflation. If the future Federal Reserve Committee leans more towards a "dovish" stance or is influenced by external factors such as tariff rhetoric, the market may pre-emptively trade the logic of rising long-term inflation, which will push up long-term US Treasury yields and have a complex impact on the US dollar.
3. How is the recent gold price movement related to the geopolitical situation?
A: Gold prices have recently pulled back from their highs, reflecting some of the market's digestion of safe-haven premiums related to the Russia-Ukraine situation . Currently, gold prices are in a stabilizing phase at high levels, with fluctuations driven more by technical correction needs and the trend of US Treasury yields. If there are unexpected signs of easing tensions in the Middle East and other regions, gold prices may further test support levels; conversely, this will support a rebound towards the $4800 level.
4. Why is the US dollar index weak despite relatively positive economic data?
A: This is mainly due to the combined effects of downward momentum in the technical indicators and the restructuring of policy expectations. After peaking in early April, the US dollar index's MACD has continued to weaken, indicating that bearish forces are in control. Furthermore, the expected differences in monetary policy between other major global economies and the US are being fine-tuned, coupled with market concerns about the US fiscal deficit and long-term inflation, making the dollar face strong resistance in the short term.
5. What key data or events should we pay special attention to in the next two days?
A: The key focus is on the Dallas Fed Manufacturing Index and the U.S. Treasury's planned auctions of 2-year and 5-year Treasury bonds. A large supply of bonds could impact the currently tight yield curve. Furthermore, although officials are on blackout ahead of this week's FOMC meeting, market discussions about leadership changes at the Fed will remain crucial in influencing sentiment.
Beneath this apparent calm, undercurrents are surging. Analysis from renowned institutions points out that the current Bollinger Band width in the US Treasury market has fallen to a five-year low, and this extreme suppression of volatility often foreshadows a sharp market move. Fundamentally, the market is closely watching potential changes in the leadership of the Federal Reserve. As the process may be accelerated, the logic surrounding the confirmation of the new chairman is reshaping market expectations for the medium- to long-term direction of monetary policy. If there are structural changes in the composition of the Federal Reserve Board of Governors in the coming months, its tolerance for inflation and its control over the interest rate path will become key variables.
US Treasury Market: Breakout Poised Amid Extremely Low Volatility
The 10-year US Treasury yield is currently hovering around 4.313% . Looking at the 240-minute chart, the Bollinger Bands are generally flat, with the middle band at 4.305% , and the price is oscillating closely around it. It's worth noting that the current Bollinger Band width is only 0.03, a historically low value suggesting the market is at a critical point of energy accumulation.
From a fundamental perspective, inflationary pressures remain robust as US economic data (such as the Texas manufacturing survey) is expected to show continued growth in production and new orders. Rising inflation expectations from the University of Michigan have further cooled market expectations for interest rate cuts. Technically, the MACD indicator shows the DIFF and DEA lines almost overlapping, with very small green bars, indicating a stalemate between bulls and bears at the 4.300% level.
In the short term, the upside resistance zone is locked at 4.34% - 4.35% . If inflation exceeds expectations or risk aversion subsides, yields may break upwards, even testing the 4.50% level. Conversely, if geopolitical tensions ease substantially, yields may retreat to the support zone of 4.27% - 4.28% . In the current environment, the market is more inclined to "sell on dips" (i.e., push up yields), as strong economic fundamentals provide a floor for yields.
US Dollar Index: Testing Lows Amid Weakness
The US dollar index is currently quoted at 98.2429 , showing a clear downward trend. Since reaching a high of 100.64 in early April, the US dollar index has been constrained by the downward-sloping middle Bollinger Band on the 240-minute chart.
The MACD indicator shows that the DIFF line remains below the DEA line, and the green bars are still expanding, indicating that the bearish momentum has not yet been fully released. The price is currently approaching the lower Bollinger Band at 98.15 . If this level is breached, the US dollar index will likely retest the support level near the previous low of 97.62 .
The dollar's weakness stems in part from market concerns about a dovish stance from future Federal Reserve officials. While current officials have reiterated their commitment to combating inflation, the market is repricing long-term policy continuity amid potential power transitions within the Fed. In the short term, 98.53 (the Bollinger Band's middle line) constitutes key resistance; unless this level is effectively recovered, the dollar's upside potential will be severely limited.
Spot gold: Technical correction after high-level pullback
Spot gold is currently priced at $4709.37 . After reaching a high of $ 4889.24 in mid-April, gold prices underwent a significant technical correction. Currently, gold prices are trading below the 240-minute Bollinger Band middle line at $4722.93 , indicating a bottoming phase after the decline.
Technical indicators are showing positive divergence signals. The MACD has formed a golden cross below the zero line (DIFF crossing above DEA), and the red bars are starting to expand slightly, which usually indicates the exhaustion of short-term downward momentum. Although the overall trend has not yet reversed, the need for a rebound is increasing.
In the next 2-3 trading days, gold needs to first challenge the 4723 resistance level. If it successfully breaks through this level, it may then test the 4800 psychological level. The key support zone below is between 4650 and 4660 ; if the geopolitical situation does not deteriorate further, this zone should provide strong support. However, considering the potential upward pressure on US Treasury yields, gold's non-interest-bearing asset status may be somewhat suppressed during any rebound.
Future Outlook
In summary, the market is expected to maintain a high volatility prelude over the next 2-3 days. The period of consolidation within an extremely narrow range for US Treasury yields is nearing its end, and directional movement will be heavily influenced by this week's large-scale Treasury bond issuance (such as the auctions of 2-year and 5-year bonds) and manufacturing data.
The US dollar index will remain under pressure in the short term, searching for a bottom within a wide range of 97.62-98.94 . Gold's price movement will be highly dependent on fluctuations in US Treasury real interest rates, with a high probability of a short-term "bottoming out and rebounding," but caution is advised regarding a potential second wave of downward pressure from a rebound in the dollar after hitting key support levels. In terms of trading environment, the market is currently in a "two-way range trading" mode; investors should closely monitor the direction of the Bollinger Bands' expansion to determine the start of a new unilateral trend.
Frequently Asked Questions
1. Why is it said that US Treasury yields are currently in a "power accumulation" phase?
A: From a technical perspective, the Bollinger Band width for the 10-year US Treasury yield has fallen to a historical low of 0.03. Market experience suggests that extremely narrow bands represent long-term suppression of volatility, often foreshadowing a subsequent explosive market movement. Given the current strong US economy, rising inflation expectations, and personnel changes at the Federal Reserve, this "calm" is highly susceptible to being disrupted by data or policy signals, potentially leading to a significant breakdown in yields.
2. What substantive impact do rumors of personnel changes within the Federal Reserve have on the market?
A: The market is focused on the selection of the new chairman and the change of members of the Board of Governors, with the core logic being the continuity of policy and the tolerance for inflation. If the future Federal Reserve Committee leans more towards a "dovish" stance or is influenced by external factors such as tariff rhetoric, the market may pre-emptively trade the logic of rising long-term inflation, which will push up long-term US Treasury yields and have a complex impact on the US dollar.
3. How is the recent gold price movement related to the geopolitical situation?
A: Gold prices have recently pulled back from their highs, reflecting some of the market's digestion of safe-haven premiums related to the Russia-Ukraine situation . Currently, gold prices are in a stabilizing phase at high levels, with fluctuations driven more by technical correction needs and the trend of US Treasury yields. If there are unexpected signs of easing tensions in the Middle East and other regions, gold prices may further test support levels; conversely, this will support a rebound towards the $4800 level.
4. Why is the US dollar index weak despite relatively positive economic data?
A: This is mainly due to the combined effects of downward momentum in the technical indicators and the restructuring of policy expectations. After peaking in early April, the US dollar index's MACD has continued to weaken, indicating that bearish forces are in control. Furthermore, the expected differences in monetary policy between other major global economies and the US are being fine-tuned, coupled with market concerns about the US fiscal deficit and long-term inflation, making the dollar face strong resistance in the short term.
5. What key data or events should we pay special attention to in the next two days?
A: The key focus is on the Dallas Fed Manufacturing Index and the U.S. Treasury's planned auctions of 2-year and 5-year Treasury bonds. A large supply of bonds could impact the currently tight yield curve. Furthermore, although officials are on blackout ahead of this week's FOMC meeting, market discussions about leadership changes at the Fed will remain crucial in influencing sentiment.
- Risk Warning and Disclaimer
- The market involves risk, and trading may not be suitable for all investors. This article is for reference only and does not constitute personal investment advice, nor does it take into account certain users’ specific investment objectives, financial situation, or other needs. Any investment decisions made based on this information are at your own risk.