India Refuses to Accept Gold? Is There Something fishy About This Small Price Surge?
2026-04-30 21:44:19
On Thursday, April 30, spot gold prices fluctuated around $4,636.04 per ounce during the North American session, up 2% from the previous trading day. India, the world's second-largest consumer, saw its imports plummet to approximately 15 tons in April, a near 30-year low, directly impacting the global supply and demand balance.
Meanwhile, continued geopolitical tensions in the Middle East pushed up oil prices, with Brent crude briefly touching $126 per barrel. This, coupled with the latest data showing US Q1 GDP growth at an annualized rate of 2.0%, initial jobless claims falling to 189,000, and March PCE rising to 3.5% year-on-year, intensified the market's interplay between gold's interest rate sensitivity and its safe-haven premium. Technically, the price is below the Bollinger Band's middle line at 4681.47, the MACD histogram remains negative but is narrowing, and the RSI14 reading is 44.20, indicating an overall mixed bullish and bearish pattern.
India's gold imports suffered a systemic disruption in April. Banks, the main importers, suspended shipments entirely after customs began collecting the 3% Integrated Goods and Services Tax (IGST), a measure previously exempted during the 2017 IGST implementation. Delayed government authorization orders resulted in retroactive tax payments, with only a small amount of physical gold cleared through the Indian International Gold and Silver Exchange, leaving approximately 8 tons of gold stranded in vaults awaiting policy clarification. Import expenditures in April totaled only about $1.3 billion, far below the monthly average of $6 billion in the previous fiscal year. Despite strong demand due to the Akshaya Tritiya festival on April 19th, supply was hampered by rejected or delayed permit applications, limiting refiners' imports of duralumin.
This contraction in demand is putting direct pressure on global markets. India imported 35 tons in April 2025, averaging about 60 tons per month in fiscal year 2025-26, a historical low excluding the 2020 pandemic. Jewelers are turning to smaller purchases on exchanges, but on a limited scale. Analysis suggests this move may serve the goals of narrowing the trade deficit and stabilizing the exchange rate, but it could also weaken the incentive to replenish inventory after traditional holidays. As a result, the global gold supply is facing a temporary demand vacuum, limiting the upside potential for prices in the short term.
Since the conflict erupted at the end of February, gold has fallen by about 12%, but has recently rebounded significantly. On April 30, spot gold recovered to around $4,630 per ounce, while June futures rose to $4,642.90 per ounce. The closure of the Strait of Hormuz cut off 20% of global oil and gas supplies, and Brent crude, after briefly breaking a four-year high, fell back to $113, with energy costs pushing up inflation expectations. Independent analyst Ross Norman pointed out that uncertainty in the Middle East is driving the recovery, and prices have found a temporary bottom. Commodity strategist Nitsh Shah emphasized that gold is returning to the upward trajectory expected during periods of geopolitical risk, with speculation that the US might escalate its actions further strengthening buying.
Silver rose 2.9% to $73.57 per ounce, while platinum gained 4.1% to $1955.70 per ounce. Iran warned that any limited attack would trigger a sustained retaliation, and Trump will be briefed on a series of strike plans on Thursday, significantly increasing market focus on safe-haven assets. Despite inflationary and interest rate pressures, geopolitical premiums have provided effective downside support for gold.
The US economy showed resilience, but inflation signals were mixed. Real GDP grew at an annualized rate of 2.0% in the first quarter, driven by both business and consumer demand. Initial jobless claims were 189,000, lower than the expected 215,000, while continuing claims fell to 1.785 million, with the four-week moving average at 2.075 million, below historical lows for this time of year. The job market remained generally solid; while AI-driven productivity improvements reduced some jobs, overall pressure for layoffs did not show a significant worsening.
However, the PCE rose 0.7% month-on-month in March, reaching 3.5% year-on-year, while core PCE rose 3.2% year-on-year. On the last day of his term, Federal Reserve Chairman Powell kept interest rates unchanged, and the market is focused on subsequent data for guidance on the timing of rate cuts. Strong employment may delay expectations of further easing and raise the cost of holding non-yielding assets, but geopolitical uncertainty and the inflation hedging effect will provide a counterbalancing factor. Policy divergence exacerbates short-term volatility in gold, and the relative strength of interest rate paths and risk premiums will be key variables.
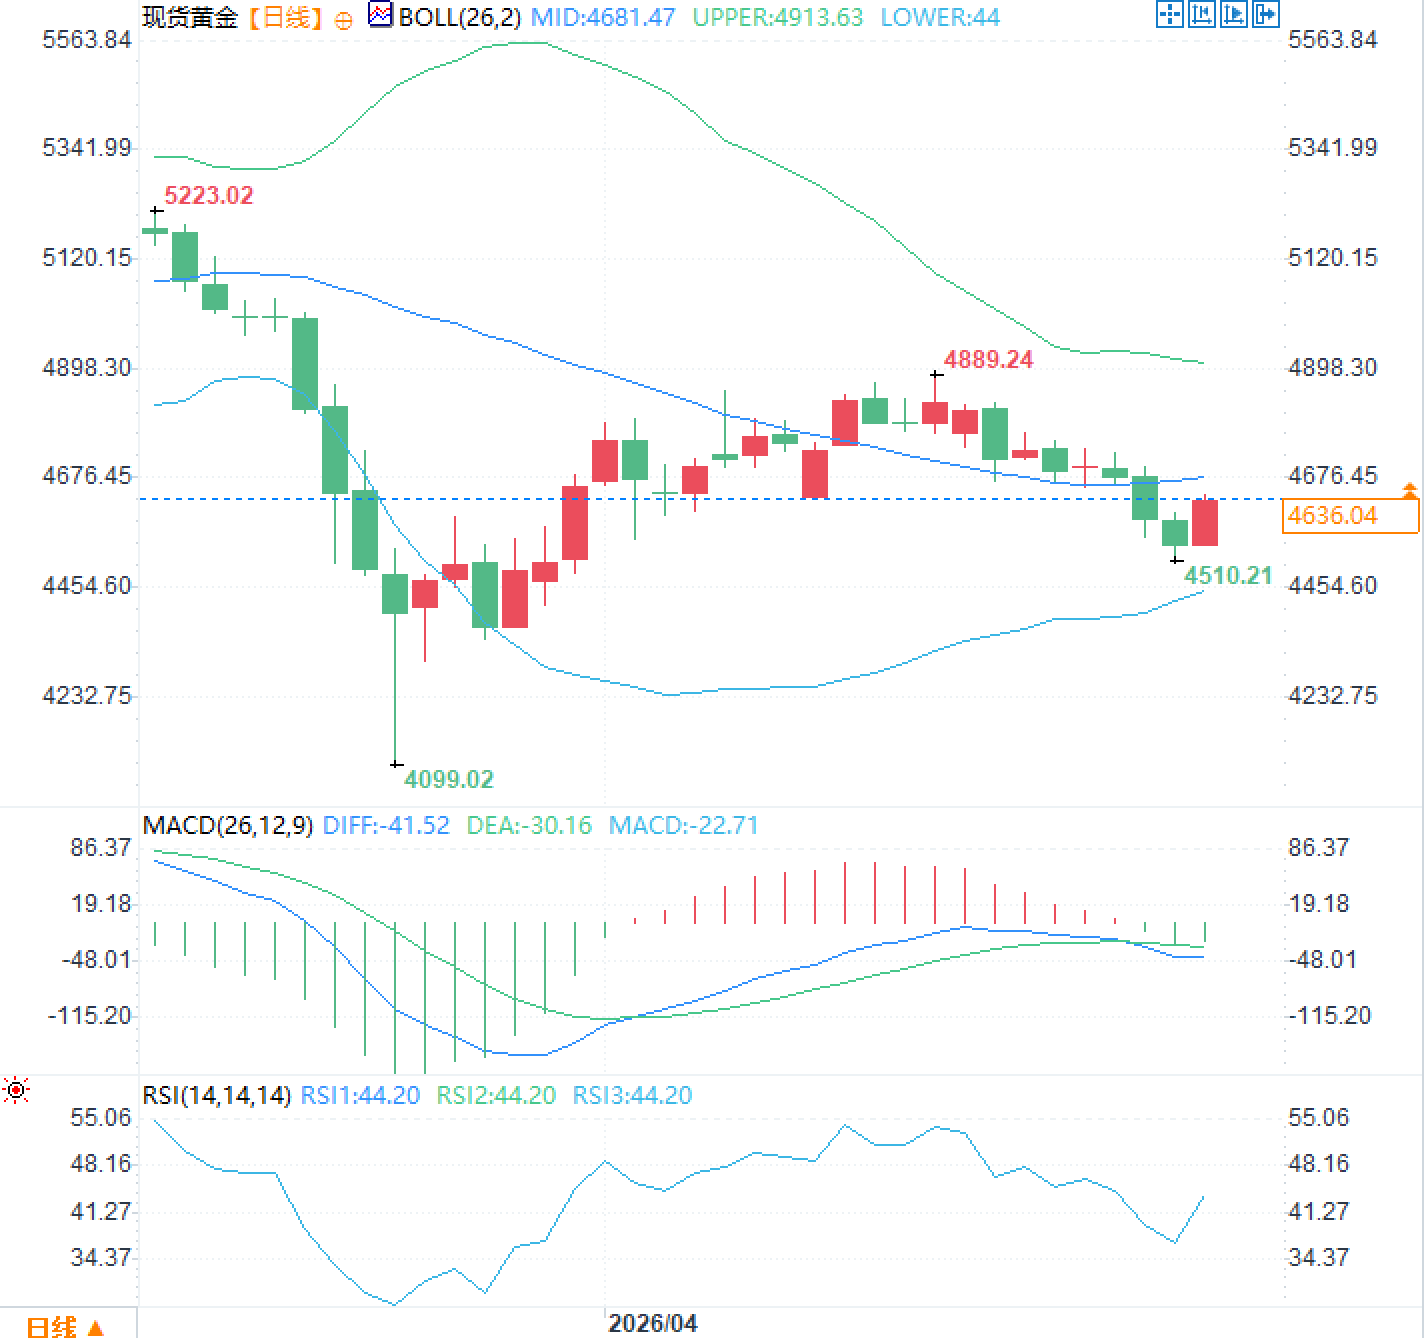
The daily chart shows spot gold at $4636.04 per ounce, with the Bollinger Bands' middle band at $4681.47, upper band at $4913.63, and lower band around $4444, with the price trading between the middle and lower bands. The previous high of $5223.02 and low of $4099.02 outline a wide trading range. The MACD indicator shows DIFF at -41.52, DEA at -30.16, and MACD at -22.71; the histogram is negative but shows signs of narrowing, indicating a slowing decline in momentum. The RSI14 reading of 44.20 is in the neutral-to-low range, suggesting room for correction after oversold conditions. Having recently rebounded from the low of $4510.21, short-term support is likely in the $4500-$4600 range, while resistance is focused on the $4680-$4700 range.
Meanwhile, continued geopolitical tensions in the Middle East pushed up oil prices, with Brent crude briefly touching $126 per barrel. This, coupled with the latest data showing US Q1 GDP growth at an annualized rate of 2.0%, initial jobless claims falling to 189,000, and March PCE rising to 3.5% year-on-year, intensified the market's interplay between gold's interest rate sensitivity and its safe-haven premium. Technically, the price is below the Bollinger Band's middle line at 4681.47, the MACD histogram remains negative but is narrowing, and the RSI14 reading is 44.20, indicating an overall mixed bullish and bearish pattern.
Tax barriers and supply chain restructuring behind India's import collapse
India's gold imports suffered a systemic disruption in April. Banks, the main importers, suspended shipments entirely after customs began collecting the 3% Integrated Goods and Services Tax (IGST), a measure previously exempted during the 2017 IGST implementation. Delayed government authorization orders resulted in retroactive tax payments, with only a small amount of physical gold cleared through the Indian International Gold and Silver Exchange, leaving approximately 8 tons of gold stranded in vaults awaiting policy clarification. Import expenditures in April totaled only about $1.3 billion, far below the monthly average of $6 billion in the previous fiscal year. Despite strong demand due to the Akshaya Tritiya festival on April 19th, supply was hampered by rejected or delayed permit applications, limiting refiners' imports of duralumin.
This contraction in demand is putting direct pressure on global markets. India imported 35 tons in April 2025, averaging about 60 tons per month in fiscal year 2025-26, a historical low excluding the 2020 pandemic. Jewelers are turning to smaller purchases on exchanges, but on a limited scale. Analysis suggests this move may serve the goals of narrowing the trade deficit and stabilizing the exchange rate, but it could also weaken the incentive to replenish inventory after traditional holidays. As a result, the global gold supply is facing a temporary demand vacuum, limiting the upside potential for prices in the short term.
| time | Import volume (tons) | Expenditure (US$ billion) |
|---|---|---|
| April 2026 | 15 | 13 |
| April 2025 | 35 | not disclosed |
| Monthly average in fiscal year 2025-26 | 60 | 60 |
Middle East geopolitical risks are reshaping the safe-haven premium for gold.
Since the conflict erupted at the end of February, gold has fallen by about 12%, but has recently rebounded significantly. On April 30, spot gold recovered to around $4,630 per ounce, while June futures rose to $4,642.90 per ounce. The closure of the Strait of Hormuz cut off 20% of global oil and gas supplies, and Brent crude, after briefly breaking a four-year high, fell back to $113, with energy costs pushing up inflation expectations. Independent analyst Ross Norman pointed out that uncertainty in the Middle East is driving the recovery, and prices have found a temporary bottom. Commodity strategist Nitsh Shah emphasized that gold is returning to the upward trajectory expected during periods of geopolitical risk, with speculation that the US might escalate its actions further strengthening buying.
Silver rose 2.9% to $73.57 per ounce, while platinum gained 4.1% to $1955.70 per ounce. Iran warned that any limited attack would trigger a sustained retaliation, and Trump will be briefed on a series of strike plans on Thursday, significantly increasing market focus on safe-haven assets. Despite inflationary and interest rate pressures, geopolitical premiums have provided effective downside support for gold.
Divergence between US economic data and the Federal Reserve's policy path
The US economy showed resilience, but inflation signals were mixed. Real GDP grew at an annualized rate of 2.0% in the first quarter, driven by both business and consumer demand. Initial jobless claims were 189,000, lower than the expected 215,000, while continuing claims fell to 1.785 million, with the four-week moving average at 2.075 million, below historical lows for this time of year. The job market remained generally solid; while AI-driven productivity improvements reduced some jobs, overall pressure for layoffs did not show a significant worsening.
However, the PCE rose 0.7% month-on-month in March, reaching 3.5% year-on-year, while core PCE rose 3.2% year-on-year. On the last day of his term, Federal Reserve Chairman Powell kept interest rates unchanged, and the market is focused on subsequent data for guidance on the timing of rate cuts. Strong employment may delay expectations of further easing and raise the cost of holding non-yielding assets, but geopolitical uncertainty and the inflation hedging effect will provide a counterbalancing factor. Policy divergence exacerbates short-term volatility in gold, and the relative strength of interest rate paths and risk premiums will be key variables.
Technical indicators reveal the balance between bulls and bears and key price ranges.
The daily chart shows spot gold at $4636.04 per ounce, with the Bollinger Bands' middle band at $4681.47, upper band at $4913.63, and lower band around $4444, with the price trading between the middle and lower bands. The previous high of $5223.02 and low of $4099.02 outline a wide trading range. The MACD indicator shows DIFF at -41.52, DEA at -30.16, and MACD at -22.71; the histogram is negative but shows signs of narrowing, indicating a slowing decline in momentum. The RSI14 reading of 44.20 is in the neutral-to-low range, suggesting room for correction after oversold conditions. Having recently rebounded from the low of $4510.21, short-term support is likely in the $4500-$4600 range, while resistance is focused on the $4680-$4700 range.
Frequently Asked Questions
Question 1: Why did India's gold imports hit a nearly 30-year low in April?
A: Banks are facing back taxes of 3% IGST. Since the exemption policy was broken in 2017, they have completely suspended shipments, with only a small amount cleared through the exchange, approximately 8 tons remaining in vaults. Obstacles to import license applications have further suppressed the refining end of the gold market, and holiday demand cannot be translated into actual customs clearance volume.
Question 2: How do the Middle East conflicts affect the short- and medium-term trends of gold prices?
A: The conflict led to disruptions in oil supply and a surge in oil prices, initially suppressing gold prices through inflation and interest rate expectations. However, uncertainty boosted safe-haven buying, and prices have rebounded by about 2% from their lows. In the medium term, if the situation continues or escalates, the safe-haven premium will continue to provide support.
Question 3: What net impact do US economic data and rising inflation have on gold?
A: A GDP growth of 2% and a low unemployment rate demonstrate economic resilience, supporting the stock market while delaying expectations of interest rate cuts and raising holding costs; the 3.5% year-on-year increase in PCE reinforces this pressure. However, the hedging effect of geopolitical risks is significant, and gold has maintained range-bound trading rather than a one-sided decline amid a confluence of factors.
- Risk Warning and Disclaimer
- The market involves risk, and trading may not be suitable for all investors. This article is for reference only and does not constitute personal investment advice, nor does it take into account certain users’ specific investment objectives, financial situation, or other needs. Any investment decisions made based on this information are at your own risk.