


Crude oil trading alert: Expectations of a US-Iran conflict are pushing oil prices higher, with short-term trading expected to continue at high levels.
2026-05-01 08:38:18
The global crude oil market experienced significant volatility this week, primarily driven by uncertainty surrounding the Middle East situation and changes in funding structures. Brent crude oil for June delivery briefly broke through $126 per barrel yesterday, reaching a new high since 2022, but as the contract neared delivery, prices quickly retreated to around $111, indicating significant profit-taking pressure at higher levels. Structurally, this volatility was not entirely driven by fundamentals, but rather a result of both liquidity contraction and changes in trading structure.

From a geopolitical perspective, the continued tensions between the US and Iran are a key variable driving up oil prices. The market is widely concerned that the conflict could escalate and become protracted, and any disruption to shipping through the Strait of Hormuz would directly impact global energy supplies. It's worth noting that the Strait of Hormuz handles approximately 20% of global seaborne crude oil transport , and any disruption to this crucial passage will be quickly reflected in prices. Furthermore, Iran's explicit statement that it will not relinquish its nuclear technology and its hints at maintaining control of the strait further amplify the supply risk premium.
However, despite clearly bullish fundamentals, the market experienced a surge followed by a pullback, reflecting that liquidity has reached its limit. According to market data, trend-following funds (CTAs) have reached 100% long positions in Brent crude oil, while WTI long positions are also around 91%. This means there is limited room for new buying, and any price fluctuations will be amplified by a lack of follow-up buying. Simultaneously, in the current trading environment, market liquidity has significantly decreased, with trading volume only a fraction of previous periods of high activity, making prices more susceptible to short-term trading.
Looking further, algorithmic trading is dominating market dynamics. In environments of insufficient liquidity, algorithmic trading, through trend-following and volatility amplification strategies, exacerbates price volatility. Market participants point out that in the current environment, price movements are "less constrained," meaning that traditional fundamental signals have less influence on short-term prices, while technical capital flows have become the dominant force. This is one reason why, after positive news drove prices up during the Asian session, a significant pullback occurred during the European and American sessions.
Meanwhile, another variable on the supply side comes from OPEC+ policy developments. Market research indicates that after the UAE's exit from OPEC+, major oil-producing countries may symbolically increase production by approximately 188,000 barrels per day in the short term. However, it should be noted that given the unresolved risks of potential conflict, the actual implementation of this production increase plan is highly uncertain, and the market remains cautious about its effectiveness in alleviating supply shortages.
In summary, the current crude oil market exhibits a structural characteristic of "strong fundamentals + weak liquidity + high leverage." On the one hand, geopolitical risks continue to provide upward support; on the other hand, crowded long positions and insufficient liquidity make the market more prone to sharp corrections. This structure suggests that oil prices will maintain high volatility rather than a one-sided trend in the short term.
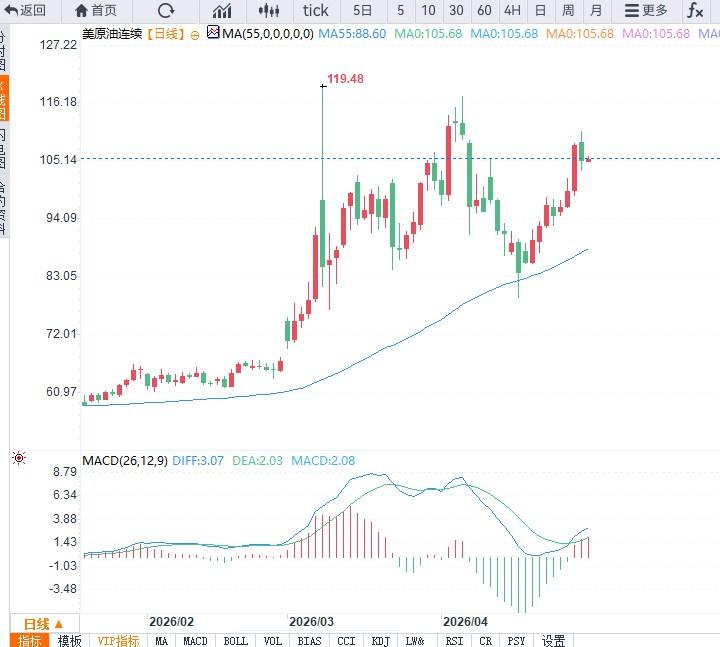
From a technical perspective, the daily chart for US crude oil shows typical high-level consolidation characteristics. After a rapid price surge, a temporary high was formed, followed by a pullback but without breaking key support, maintaining an overall strong trend. Looking at key levels, the $100 level constitutes strong medium-term support . This area is both a previous breakout platform and a crucial defensive position for the bulls. As long as this level is not effectively broken, the market will likely maintain its high-level trading pattern.
Looking at the upside, a clear resistance zone has formed around $112 , which corresponds to a previous area of dense trading and a recent high. Multiple tests of this level have failed to break through, indicating limited upward momentum in the short term. If a breakout above $112 with significant volume occurs, it could open up new upside potential; conversely, if multiple attempts to break through fail, range-bound trading or even a pullback may continue.
In terms of momentum indicators, the daily RSI has fallen from a high level to the neutral zone, indicating that the upward momentum has cooled somewhat but has not yet weakened; the MACD indicator has shown signs of convergence after being overbought, suggesting that the market is transitioning from a trending market to a consolidation structure. Overall, the technical and fundamental factors are in sync, both pointing to a high-level consolidation pattern.
Editor's Summary : US crude oil is currently in a critical range-bound trading phase. Geopolitical risks continue to provide support at the bottom, but capital and technical factors limit upside potential. In the short term, oil prices are more likely to fluctuate repeatedly within the $100-$112 range, awaiting new fundamental catalysts. Investors should pay close attention to changes in the Middle East situation and capital flows; a breakout from this range will determine the direction of the next trend.
From a geopolitical perspective, the continued tensions between the US and Iran are a key variable driving up oil prices. The market is widely concerned that the conflict could escalate and become protracted, and any disruption to shipping through the Strait of Hormuz would directly impact global energy supplies. It's worth noting that the Strait of Hormuz handles approximately 20% of global seaborne crude oil transport , and any disruption to this crucial passage will be quickly reflected in prices. Furthermore, Iran's explicit statement that it will not relinquish its nuclear technology and its hints at maintaining control of the strait further amplify the supply risk premium.
However, despite clearly bullish fundamentals, the market experienced a surge followed by a pullback, reflecting that liquidity has reached its limit. According to market data, trend-following funds (CTAs) have reached 100% long positions in Brent crude oil, while WTI long positions are also around 91%. This means there is limited room for new buying, and any price fluctuations will be amplified by a lack of follow-up buying. Simultaneously, in the current trading environment, market liquidity has significantly decreased, with trading volume only a fraction of previous periods of high activity, making prices more susceptible to short-term trading.
Looking further, algorithmic trading is dominating market dynamics. In environments of insufficient liquidity, algorithmic trading, through trend-following and volatility amplification strategies, exacerbates price volatility. Market participants point out that in the current environment, price movements are "less constrained," meaning that traditional fundamental signals have less influence on short-term prices, while technical capital flows have become the dominant force. This is one reason why, after positive news drove prices up during the Asian session, a significant pullback occurred during the European and American sessions.
Meanwhile, another variable on the supply side comes from OPEC+ policy developments. Market research indicates that after the UAE's exit from OPEC+, major oil-producing countries may symbolically increase production by approximately 188,000 barrels per day in the short term. However, it should be noted that given the unresolved risks of potential conflict, the actual implementation of this production increase plan is highly uncertain, and the market remains cautious about its effectiveness in alleviating supply shortages.
In summary, the current crude oil market exhibits a structural characteristic of "strong fundamentals + weak liquidity + high leverage." On the one hand, geopolitical risks continue to provide upward support; on the other hand, crowded long positions and insufficient liquidity make the market more prone to sharp corrections. This structure suggests that oil prices will maintain high volatility rather than a one-sided trend in the short term.
From a technical perspective, the daily chart for US crude oil shows typical high-level consolidation characteristics. After a rapid price surge, a temporary high was formed, followed by a pullback but without breaking key support, maintaining an overall strong trend. Looking at key levels, the $100 level constitutes strong medium-term support . This area is both a previous breakout platform and a crucial defensive position for the bulls. As long as this level is not effectively broken, the market will likely maintain its high-level trading pattern.
Looking at the upside, a clear resistance zone has formed around $112 , which corresponds to a previous area of dense trading and a recent high. Multiple tests of this level have failed to break through, indicating limited upward momentum in the short term. If a breakout above $112 with significant volume occurs, it could open up new upside potential; conversely, if multiple attempts to break through fail, range-bound trading or even a pullback may continue.
In terms of momentum indicators, the daily RSI has fallen from a high level to the neutral zone, indicating that the upward momentum has cooled somewhat but has not yet weakened; the MACD indicator has shown signs of convergence after being overbought, suggesting that the market is transitioning from a trending market to a consolidation structure. Overall, the technical and fundamental factors are in sync, both pointing to a high-level consolidation pattern.
Editor's Summary : US crude oil is currently in a critical range-bound trading phase. Geopolitical risks continue to provide support at the bottom, but capital and technical factors limit upside potential. In the short term, oil prices are more likely to fluctuate repeatedly within the $100-$112 range, awaiting new fundamental catalysts. Investors should pay close attention to changes in the Middle East situation and capital flows; a breakout from this range will determine the direction of the next trend.
- Risk Warning and Disclaimer
- The market involves risk, and trading may not be suitable for all investors. This article is for reference only and does not constitute personal investment advice, nor does it take into account certain users’ specific investment objectives, financial situation, or other needs. Any investment decisions made based on this information are at your own risk.
