Gold prices are likely to maintain a slow downward trend or fluctuate within a range.
2026-05-02 02:07:00
Spot gold struggled to establish a clear upward trend around May 1st, with each rebound this week met with selling pressure. The strong performance of the US 10-year Treasury yield, the unchanged policy stance of the Federal Reserve, and the persistently strong US dollar have all put downward pressure on gold prices this week, likely resulting in a weekly decline.

US Treasury yields dominate gold market trends
The yield on the 10-year US Treasury note remained near 4.40%, a level that significantly suppressed gold prices. Earlier this week, international oil prices surged, driving up market inflation expectations and causing US Treasury yields to rise accordingly. Although yields retreated slightly during the day, the decline was limited and insufficient to effectively boost gold prices. Currently, the 4.30%–4.40% range has become a key watershed for gold price movements. As long as yields continue to hold above this range, the market lacks the incentive to buy gold, and buying interest remains weak.
Federal Reserve policies are unlikely to provide an opportunity for gold prices to rise.
The market has clearly anticipated that the Federal Reserve will not initiate a rate-cutting cycle in the short term, and no signals of policy easing have emerged. At the beginning of the year, the market bet on the Fed starting rate cuts, which provided significant support for gold; now, with rate cut expectations pushed back to the end of 2026 or even later, the policy support that fueled gold's strength has diminished. The Fed continues to prioritize inflation control as a core policy objective, and real yields remain high. These two factors combined make it difficult for the gold market to attract new buying interest.
Crude oil prices trigger a chain reaction in the market.
This week, WTI crude oil prices for June delivery surged first, triggering a chain reaction in the market: rising oil prices boosted inflation expectations, which in turn drove up US Treasury yields, ultimately suppressing gold's rebound. Market movements perfectly followed this transmission path. Subsequently, influenced by supply-related news, oil prices retreated from their highs, and US Treasury yields weakened slightly, allowing gold to experience a brief rebound. This type of market fluctuation only represents a temporary easing of pressure and does not indicate a trend reversal.
A slight pullback in the US dollar is unlikely to change the overall trend for gold.
The US dollar index weakened slightly during the day, providing a brief upward opportunity for gold. However, the overall trend of the dollar remains strong, continuing to divert funds from international markets and diminishing the attractiveness of gold as an investment. The intraday pullback in the dollar only provides a short-term correction and does not change the overall weak medium- to long-term structure of gold.
Technical trend analysis
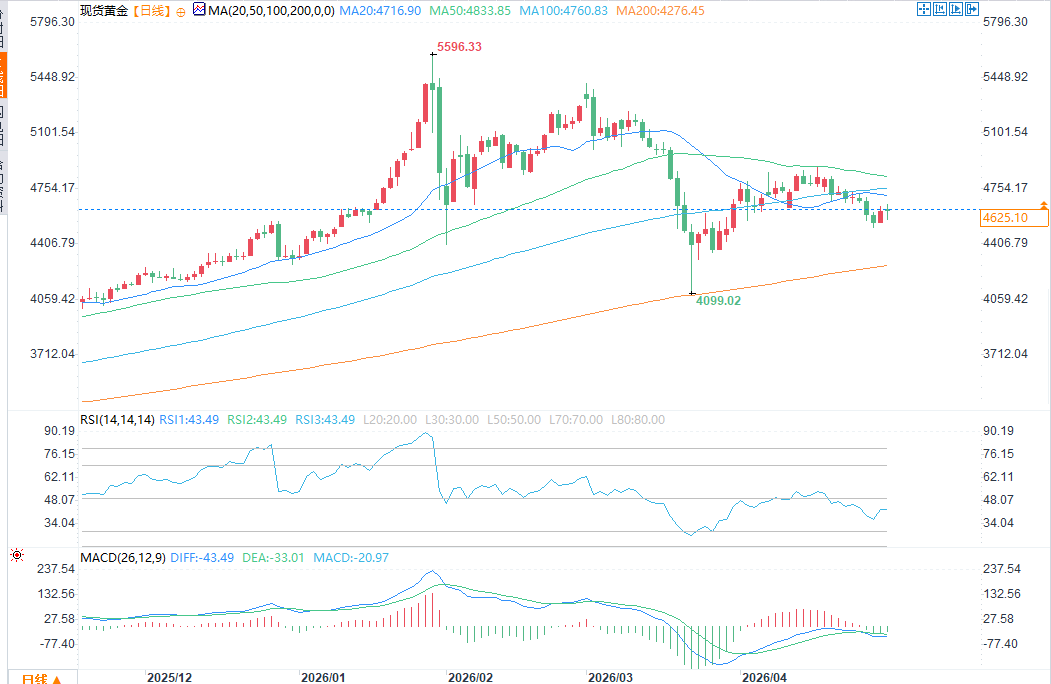
(Spot gold daily chart source: FX678)
Spot gold rebounded slightly on Friday after stabilizing from earlier weakness. Looking at the daily chart, the overall trend remains downward, but two consecutive trading days saw new lows, forming a new short-term bottom at $4510.09. Gold is currently holding above the key 61.8% Fibonacci retracement level of $4541.89, slightly above the short-term pullback range of $4495.33 to $4401.84. This support area is generally above the 200-day moving average at $4277.02, which currently firmly supports the long-term upward trend in gold.
The daily chart shows that gold prices still have the momentum to extend their rebound, with the primary resistance level near the long-term 50% retracement level at $4744.34. This price level corresponds to the midpoint between the low of $3886.46 on October 28th last year and the high of $5602.23 on January 29th this year, and has consistently dominated the range-bound trading of gold prices for several months.
In recent months, the 50-day moving average at $4832.81 and the 200-day moving average at $4277.02 have consistently influenced market trends, with gold prices oscillating narrowly between these two moving averages for an extended period. Price fluctuations have been compressed by both indicators. For trend traders, this range-bound trading lacks sustained volatility; however, from a chart pattern perspective, this is a normal corrective movement following the significant gold price surge in early 2026.
If traders cannot flexibly switch their trading strategies, adapting from trend trading to range-bound trading, the market movements of the past three months will be difficult to predict. This is especially noticeable for participants who view gold as a safe-haven asset rather than an investment. Commodities inherently exhibit alternating periods of trending and range-bound trading, which is a normal market phenomenon.
McKinsey research shows that commodities spend the vast majority of their time in mean reversion or range-bound trading, exhibiting a clear trend only 20%–30% of the time, while remaining in a sideways consolidation phase for the remaining 70%–80%. Research from institutions such as the World Gold Council also indicates that gold price volatility is unevenly distributed, with prices often entering a long period of sideways trading, followed by a period of significant upward movement.
Last year, during months of heightened geopolitical risk, gold significantly outperformed the S&P 500; conversely, during periods of improved risk sentiment, gold prices remained range-bound. This year, gold broke out of its long-term consolidation pattern and entered a trending market, potentially completing a typical 20%–30% trend cycle for commodities. The market is likely to return to a range-bound phase, but trading opportunities will still exist within this consolidation period.
Gold prices rebounded after hitting a low on March 23, finding solid support at the 200-day moving average of $4099.12, confirming the bottom support level of this moving average. On April 17, gold prices fell back under pressure, encountering resistance at the 50-day moving average of $4891.54, confirming the top resistance level of this moving average. This week's price action confirms that gold can still find support and stabilize within the range of these two moving averages. The two consecutive days of rebound indicate that the market has entered a buying-on-dips trading pattern; while the previous repeated pressure from the 50-day moving average also reflects the market's consistent strategy of selling on rallies.
Currently, there are only two trading strategies in the market: actively positioning oneself and waiting for the price to break through resistance, or remaining on the sidelines and waiting for the price to fall back to the value support range before entering the market. The market is not suitable for a passive trading model of one-time positioning and long-term holding.
Key points for market observation
The current gold market continues its overall pattern of rebounding and selling. Although gold prices have held key support levels, market funds are unwilling to enter the market on a large scale at current price levels. The trend of the US 10-year Treasury yield and the expectation of a Federal Reserve interest rate cut are the two core factors influencing the future price of gold. Before these two variables show a reversal signal favorable to gold, gold prices are likely to maintain a slow downward trend or a sideways trading range.
US Treasury yields dominate gold market trends
The yield on the 10-year US Treasury note remained near 4.40%, a level that significantly suppressed gold prices. Earlier this week, international oil prices surged, driving up market inflation expectations and causing US Treasury yields to rise accordingly. Although yields retreated slightly during the day, the decline was limited and insufficient to effectively boost gold prices. Currently, the 4.30%–4.40% range has become a key watershed for gold price movements. As long as yields continue to hold above this range, the market lacks the incentive to buy gold, and buying interest remains weak.
Federal Reserve policies are unlikely to provide an opportunity for gold prices to rise.
The market has clearly anticipated that the Federal Reserve will not initiate a rate-cutting cycle in the short term, and no signals of policy easing have emerged. At the beginning of the year, the market bet on the Fed starting rate cuts, which provided significant support for gold; now, with rate cut expectations pushed back to the end of 2026 or even later, the policy support that fueled gold's strength has diminished. The Fed continues to prioritize inflation control as a core policy objective, and real yields remain high. These two factors combined make it difficult for the gold market to attract new buying interest.
Crude oil prices trigger a chain reaction in the market.
This week, WTI crude oil prices for June delivery surged first, triggering a chain reaction in the market: rising oil prices boosted inflation expectations, which in turn drove up US Treasury yields, ultimately suppressing gold's rebound. Market movements perfectly followed this transmission path. Subsequently, influenced by supply-related news, oil prices retreated from their highs, and US Treasury yields weakened slightly, allowing gold to experience a brief rebound. This type of market fluctuation only represents a temporary easing of pressure and does not indicate a trend reversal.
A slight pullback in the US dollar is unlikely to change the overall trend for gold.
The US dollar index weakened slightly during the day, providing a brief upward opportunity for gold. However, the overall trend of the dollar remains strong, continuing to divert funds from international markets and diminishing the attractiveness of gold as an investment. The intraday pullback in the dollar only provides a short-term correction and does not change the overall weak medium- to long-term structure of gold.
Technical trend analysis
(Spot gold daily chart source: FX678)
Spot gold rebounded slightly on Friday after stabilizing from earlier weakness. Looking at the daily chart, the overall trend remains downward, but two consecutive trading days saw new lows, forming a new short-term bottom at $4510.09. Gold is currently holding above the key 61.8% Fibonacci retracement level of $4541.89, slightly above the short-term pullback range of $4495.33 to $4401.84. This support area is generally above the 200-day moving average at $4277.02, which currently firmly supports the long-term upward trend in gold.
The daily chart shows that gold prices still have the momentum to extend their rebound, with the primary resistance level near the long-term 50% retracement level at $4744.34. This price level corresponds to the midpoint between the low of $3886.46 on October 28th last year and the high of $5602.23 on January 29th this year, and has consistently dominated the range-bound trading of gold prices for several months.
In recent months, the 50-day moving average at $4832.81 and the 200-day moving average at $4277.02 have consistently influenced market trends, with gold prices oscillating narrowly between these two moving averages for an extended period. Price fluctuations have been compressed by both indicators. For trend traders, this range-bound trading lacks sustained volatility; however, from a chart pattern perspective, this is a normal corrective movement following the significant gold price surge in early 2026.
If traders cannot flexibly switch their trading strategies, adapting from trend trading to range-bound trading, the market movements of the past three months will be difficult to predict. This is especially noticeable for participants who view gold as a safe-haven asset rather than an investment. Commodities inherently exhibit alternating periods of trending and range-bound trading, which is a normal market phenomenon.
McKinsey research shows that commodities spend the vast majority of their time in mean reversion or range-bound trading, exhibiting a clear trend only 20%–30% of the time, while remaining in a sideways consolidation phase for the remaining 70%–80%. Research from institutions such as the World Gold Council also indicates that gold price volatility is unevenly distributed, with prices often entering a long period of sideways trading, followed by a period of significant upward movement.
Last year, during months of heightened geopolitical risk, gold significantly outperformed the S&P 500; conversely, during periods of improved risk sentiment, gold prices remained range-bound. This year, gold broke out of its long-term consolidation pattern and entered a trending market, potentially completing a typical 20%–30% trend cycle for commodities. The market is likely to return to a range-bound phase, but trading opportunities will still exist within this consolidation period.
Gold prices rebounded after hitting a low on March 23, finding solid support at the 200-day moving average of $4099.12, confirming the bottom support level of this moving average. On April 17, gold prices fell back under pressure, encountering resistance at the 50-day moving average of $4891.54, confirming the top resistance level of this moving average. This week's price action confirms that gold can still find support and stabilize within the range of these two moving averages. The two consecutive days of rebound indicate that the market has entered a buying-on-dips trading pattern; while the previous repeated pressure from the 50-day moving average also reflects the market's consistent strategy of selling on rallies.
Currently, there are only two trading strategies in the market: actively positioning oneself and waiting for the price to break through resistance, or remaining on the sidelines and waiting for the price to fall back to the value support range before entering the market. The market is not suitable for a passive trading model of one-time positioning and long-term holding.
Key points for market observation
The current gold market continues its overall pattern of rebounding and selling. Although gold prices have held key support levels, market funds are unwilling to enter the market on a large scale at current price levels. The trend of the US 10-year Treasury yield and the expectation of a Federal Reserve interest rate cut are the two core factors influencing the future price of gold. Before these two variables show a reversal signal favorable to gold, gold prices are likely to maintain a slow downward trend or a sideways trading range.
- Risk Warning and Disclaimer
- The market involves risk, and trading may not be suitable for all investors. This article is for reference only and does not constitute personal investment advice, nor does it take into account certain users’ specific investment objectives, financial situation, or other needs. Any investment decisions made based on this information are at your own risk.