Iran's "double whammy": US Treasury bond death cross drives dollar collapse, gold and gold form V-shaped reversal?
2026-05-06 21:26:28
On Wednesday (May 6), global financial markets experienced a sharp fluctuation triggered by a sudden reversal in the Middle East situation. Amidst rumors of a peace agreement memorandum and tough statements from Iranian officials, market sentiment shifted rapidly from a return to risk aversion. As a result, US Treasury yields plummeted, the US dollar index weakened, while spot gold regained its upward momentum driven by the safe-haven logic transmitted through the bond market.

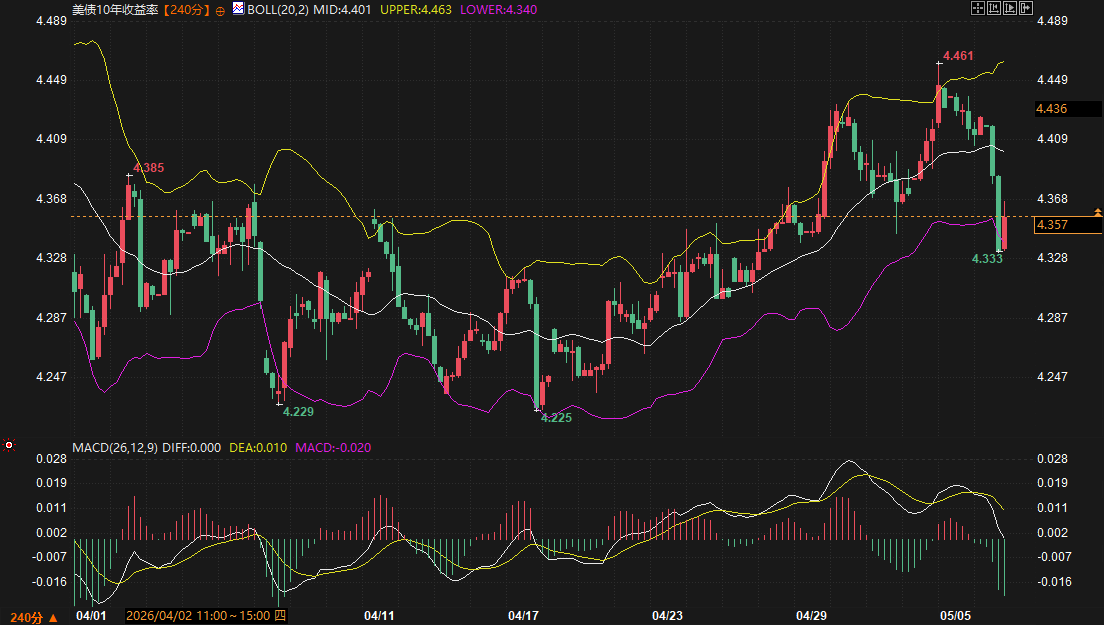
The US Treasury market has recently exhibited a strong "policy-driven" characteristic. Looking at the 240-minute chart, the 10-year US Treasury yield, after reaching a high of 4.461% , has fallen rapidly due to expectations of a potential easing of geopolitical tensions. Technically, the yield curve has formed several consecutive large bearish candlesticks, breaking below the Bollinger Band middle line and directly testing the lower band support near 4.340 . The MACD indicator shows the DIFF line crossing below the DEA line, forming a death cross , with the histogram rapidly turning green and continuing to expand, indicating that short-term bearish momentum is being concentrated.
This weakening of the bond market has directly eroded the support for the US dollar index. After reaching a high of 100.28 in early April, the US dollar index entered a downward trend and has currently tested the key low of 97.71 . As the decline in US Treasury yields has narrowed the interest rate differential with other major currencies, coupled with divergent market expectations regarding the future policy path of the Federal Reserve due to the complexity of inflation caused by regional conflicts, the attractiveness of the US dollar has weakened significantly in the short term. Surveys by well-known institutions show that while dollar positions are currently net long, sentiment is extremely sensitive. If US Treasury yields cannot stabilize in the 4.334-4.340 range, the US dollar index may further approach the first support level of 97.63 .
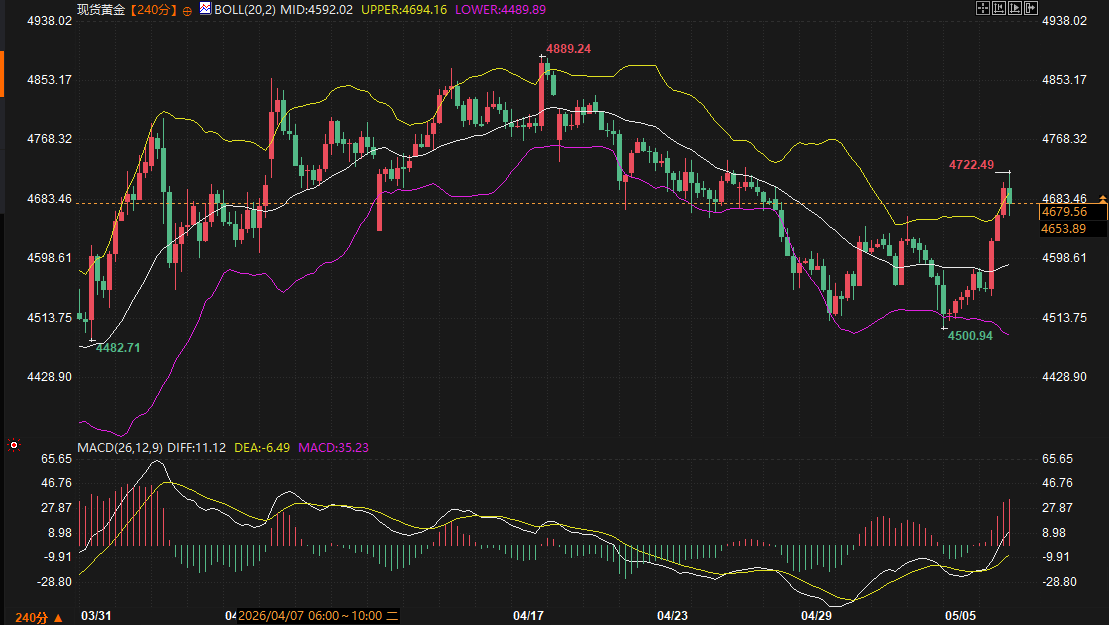
As the US dollar weakened, spot gold exhibited a textbook example of a safe-haven rebound. Gold prices surged to $ 4712.89 at one point during the trading day, reaching a new high since late April. This rally in gold was not solely driven by direct geopolitical shocks, but rather by lower holding costs due to declining bond yields and demand for hedging against potential economic uncertainties.
From a 240-minute technical perspective, spot gold is currently in a crucial phase of "bottoming out and rebounding." Despite a deep pullback from the high of 4889.24, it found strong support at 4500.94 and has recently begun a V-shaped reversal. The MACD indicator is currently showing a golden cross signal, with the DIFF line breaking upwards from the DEA line, and the MACD histogram continuing to expand, reflecting dominant bullish sentiment. The price has now broken through the Bollinger Band middle line at 4592.02 and is now challenging the upper resistance level at 4694.16 . As long as the bond market maintains its current weakness, the safe-haven support logic for gold will remain effective.
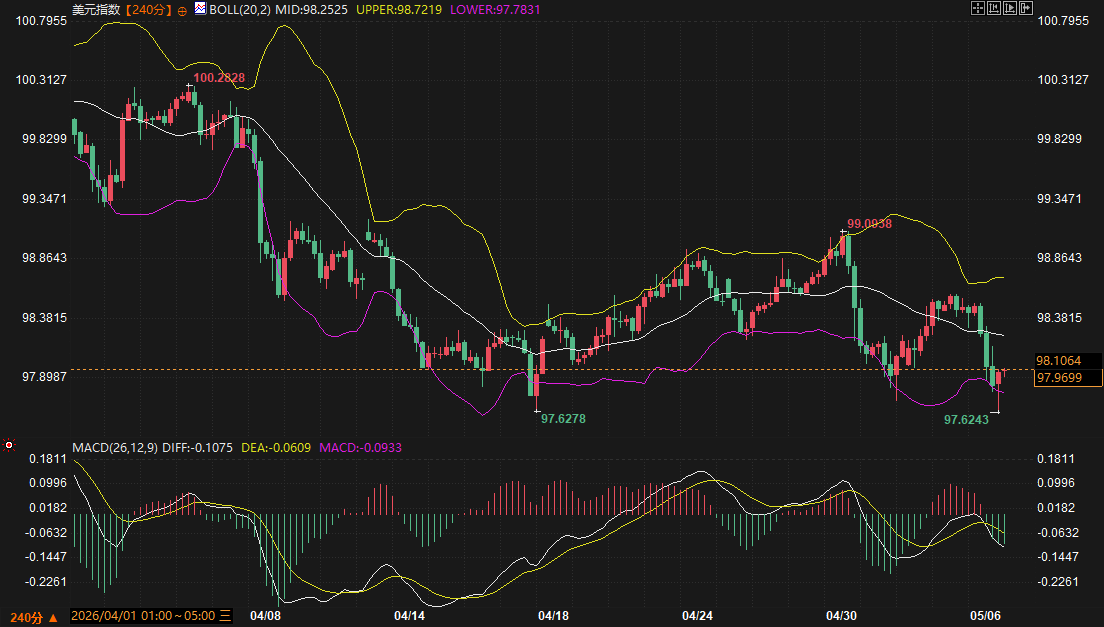
Over the next 2-3 trading days, market focus will remain on policy developments and evolving circumstances. For the US dollar index, the 97.62-97.78 range will be a key psychological and technical support level. Given that the dollar is currently in a MACD death cross expansion phase and is under multiple pressures from declining US Treasury yields, a break below this range could trigger a larger-scale technical sell-off. Conversely, if renewed tensions lead to a rise in yields, the dollar may find some respite near the lower Bollinger Band, with short-term resistance levels to watch at 98.25 (middle band) to 98.72 (upper band).
In the spot gold market, the short-term upward trend is clear, but selling pressure near historical highs should not be ignored. The expected trading range is between $ 4650 and $4750 . Key support levels to watch are the Bollinger Band middle line around $4592 ; resistance levels are the downward trendline derived from previous highs and the upper Bollinger Band at $4694 . Investors should closely monitor intraday information regarding the navigation status of key waterways and the latest policy statements.
The trend of the 10-year US Treasury yield will be the core anchor for all asset pricing. In the short term, pay attention to the support level in the 4.334-4.357 range. A break below this range would indicate a weakening of market concerns about runaway long-term inflation, which would further push up gold prices and suppress the dollar. Conversely, if the yield finds support at the lower bound and rebounds, the market will return to the logic of "strong dollar, weak gold."
Q: Why does the current decline in US Treasury yields have such a direct negative impact on the US dollar?
A: The yield on US Treasury bonds represents the risk-free rate of return for holding US dollar assets. When yields fall, the US dollar becomes less attractive to international capital, and funds tend to flow to other assets with higher returns or stronger safe-haven attributes, thus causing the dollar exchange rate to weaken.
Q: In the recent rebound of gold, which factor, geopolitical or bond market factors, is more dominant?
A: The two are complementary. Geopolitical instability provides a "reason" for safe-haven investment, but the real driving force behind the large-scale inflow of funds into gold comes from the decline in bond yields. Lower yields reduce the opportunity cost of holding non-interest-bearing assets (such as gold), making gold more valuable in an uncertain environment.
Q: How do you understand the impact of the "tariff rhetoric" mentioned in the material on market sentiment?
A: Such comments are often seen by the market as potential factors contributing to future inflation and disruptions to global trade chains. This tends to push up inflation expectations, which on the one hand may force interest rates to remain high, and on the other hand may stimulate risk aversion in the market, thus providing support for the US dollar and gold at different stages.
Q: From a technical perspective, does the fact that the US dollar index is approaching the lower Bollinger Band mean that a rebound is imminent?
A: In technical analysis, the lower Bollinger Band is generally considered a short-term oversold signal, indicating a potential technical need for a rebound. However, it must be considered in conjunction with trend indicators such as MACD. Currently, the US dollar's MACD has formed a death cross and the histogram is expanding, showing that the downward momentum remains strong. Relying solely on the Bollinger Band touching the lower band for judgment is lagging; it is necessary to pay attention to the stabilization of key levels.
Q: Why do the tough statements from Iranian officials and rumors of peace cause market fluctuations?
A: This reflects the market's current state of being in an "information vacuum" and "highly sensitive period" regarding the situation in the Middle East. Any contradictory news can trigger violent two-way sweeps by algorithmic trading and short-term funds, causing prices to reach extreme values in a short period of time. This is why the recent market has shown wide fluctuations.
Restructuring of Bond Market Logic: The pullback in US Treasury yields weighs on the dollar.
The US Treasury market has recently exhibited a strong "policy-driven" characteristic. Looking at the 240-minute chart, the 10-year US Treasury yield, after reaching a high of 4.461% , has fallen rapidly due to expectations of a potential easing of geopolitical tensions. Technically, the yield curve has formed several consecutive large bearish candlesticks, breaking below the Bollinger Band middle line and directly testing the lower band support near 4.340 . The MACD indicator shows the DIFF line crossing below the DEA line, forming a death cross , with the histogram rapidly turning green and continuing to expand, indicating that short-term bearish momentum is being concentrated.
This weakening of the bond market has directly eroded the support for the US dollar index. After reaching a high of 100.28 in early April, the US dollar index entered a downward trend and has currently tested the key low of 97.71 . As the decline in US Treasury yields has narrowed the interest rate differential with other major currencies, coupled with divergent market expectations regarding the future policy path of the Federal Reserve due to the complexity of inflation caused by regional conflicts, the attractiveness of the US dollar has weakened significantly in the short term. Surveys by well-known institutions show that while dollar positions are currently net long, sentiment is extremely sensitive. If US Treasury yields cannot stabilize in the 4.334-4.340 range, the US dollar index may further approach the first support level of 97.63 .
Safe-haven effect transmission: Bond market volatility triggers strong rebound in gold prices
As the US dollar weakened, spot gold exhibited a textbook example of a safe-haven rebound. Gold prices surged to $ 4712.89 at one point during the trading day, reaching a new high since late April. This rally in gold was not solely driven by direct geopolitical shocks, but rather by lower holding costs due to declining bond yields and demand for hedging against potential economic uncertainties.
From a 240-minute technical perspective, spot gold is currently in a crucial phase of "bottoming out and rebounding." Despite a deep pullback from the high of 4889.24, it found strong support at 4500.94 and has recently begun a V-shaped reversal. The MACD indicator is currently showing a golden cross signal, with the DIFF line breaking upwards from the DEA line, and the MACD histogram continuing to expand, reflecting dominant bullish sentiment. The price has now broken through the Bollinger Band middle line at 4592.02 and is now challenging the upper resistance level at 4694.16 . As long as the bond market maintains its current weakness, the safe-haven support logic for gold will remain effective.
Short-term outlook: Range forecast under high volatility
Over the next 2-3 trading days, market focus will remain on policy developments and evolving circumstances. For the US dollar index, the 97.62-97.78 range will be a key psychological and technical support level. Given that the dollar is currently in a MACD death cross expansion phase and is under multiple pressures from declining US Treasury yields, a break below this range could trigger a larger-scale technical sell-off. Conversely, if renewed tensions lead to a rise in yields, the dollar may find some respite near the lower Bollinger Band, with short-term resistance levels to watch at 98.25 (middle band) to 98.72 (upper band).
In the spot gold market, the short-term upward trend is clear, but selling pressure near historical highs should not be ignored. The expected trading range is between $ 4650 and $4750 . Key support levels to watch are the Bollinger Band middle line around $4592 ; resistance levels are the downward trendline derived from previous highs and the upper Bollinger Band at $4694 . Investors should closely monitor intraday information regarding the navigation status of key waterways and the latest policy statements.
The trend of the 10-year US Treasury yield will be the core anchor for all asset pricing. In the short term, pay attention to the support level in the 4.334-4.357 range. A break below this range would indicate a weakening of market concerns about runaway long-term inflation, which would further push up gold prices and suppress the dollar. Conversely, if the yield finds support at the lower bound and rebounds, the market will return to the logic of "strong dollar, weak gold."
Frequently Asked Questions
Q: Why does the current decline in US Treasury yields have such a direct negative impact on the US dollar?
A: The yield on US Treasury bonds represents the risk-free rate of return for holding US dollar assets. When yields fall, the US dollar becomes less attractive to international capital, and funds tend to flow to other assets with higher returns or stronger safe-haven attributes, thus causing the dollar exchange rate to weaken.
Q: In the recent rebound of gold, which factor, geopolitical or bond market factors, is more dominant?
A: The two are complementary. Geopolitical instability provides a "reason" for safe-haven investment, but the real driving force behind the large-scale inflow of funds into gold comes from the decline in bond yields. Lower yields reduce the opportunity cost of holding non-interest-bearing assets (such as gold), making gold more valuable in an uncertain environment.
Q: How do you understand the impact of the "tariff rhetoric" mentioned in the material on market sentiment?
A: Such comments are often seen by the market as potential factors contributing to future inflation and disruptions to global trade chains. This tends to push up inflation expectations, which on the one hand may force interest rates to remain high, and on the other hand may stimulate risk aversion in the market, thus providing support for the US dollar and gold at different stages.
Q: From a technical perspective, does the fact that the US dollar index is approaching the lower Bollinger Band mean that a rebound is imminent?
A: In technical analysis, the lower Bollinger Band is generally considered a short-term oversold signal, indicating a potential technical need for a rebound. However, it must be considered in conjunction with trend indicators such as MACD. Currently, the US dollar's MACD has formed a death cross and the histogram is expanding, showing that the downward momentum remains strong. Relying solely on the Bollinger Band touching the lower band for judgment is lagging; it is necessary to pay attention to the stabilization of key levels.
Q: Why do the tough statements from Iranian officials and rumors of peace cause market fluctuations?
A: This reflects the market's current state of being in an "information vacuum" and "highly sensitive period" regarding the situation in the Middle East. Any contradictory news can trigger violent two-way sweeps by algorithmic trading and short-term funds, causing prices to reach extreme values in a short period of time. This is why the recent market has shown wide fluctuations.
- Risk Warning and Disclaimer
- The market involves risk, and trading may not be suitable for all investors. This article is for reference only and does not constitute personal investment advice, nor does it take into account certain users’ specific investment objectives, financial situation, or other needs. Any investment decisions made based on this information are at your own risk.