Gold breaks out! A dramatic rebound from 4500 to 4700 – what are the major funds positioning themselves for?
2026-05-06 22:07:43
On Wednesday, May 6th, the spot gold market saw a significant rebound. Spot gold prices rose by about 3%, trading around $4,700 per ounce, hitting their highest level since April 27th during the session. The dollar index fell 0.5%, boosting buying interest from non-dollar holders. This move stemmed directly from reports that the US and Iran might be close to reaching a peace agreement, which quickly eased market concerns about high oil prices leading to increased inflation and persistently high interest rates.
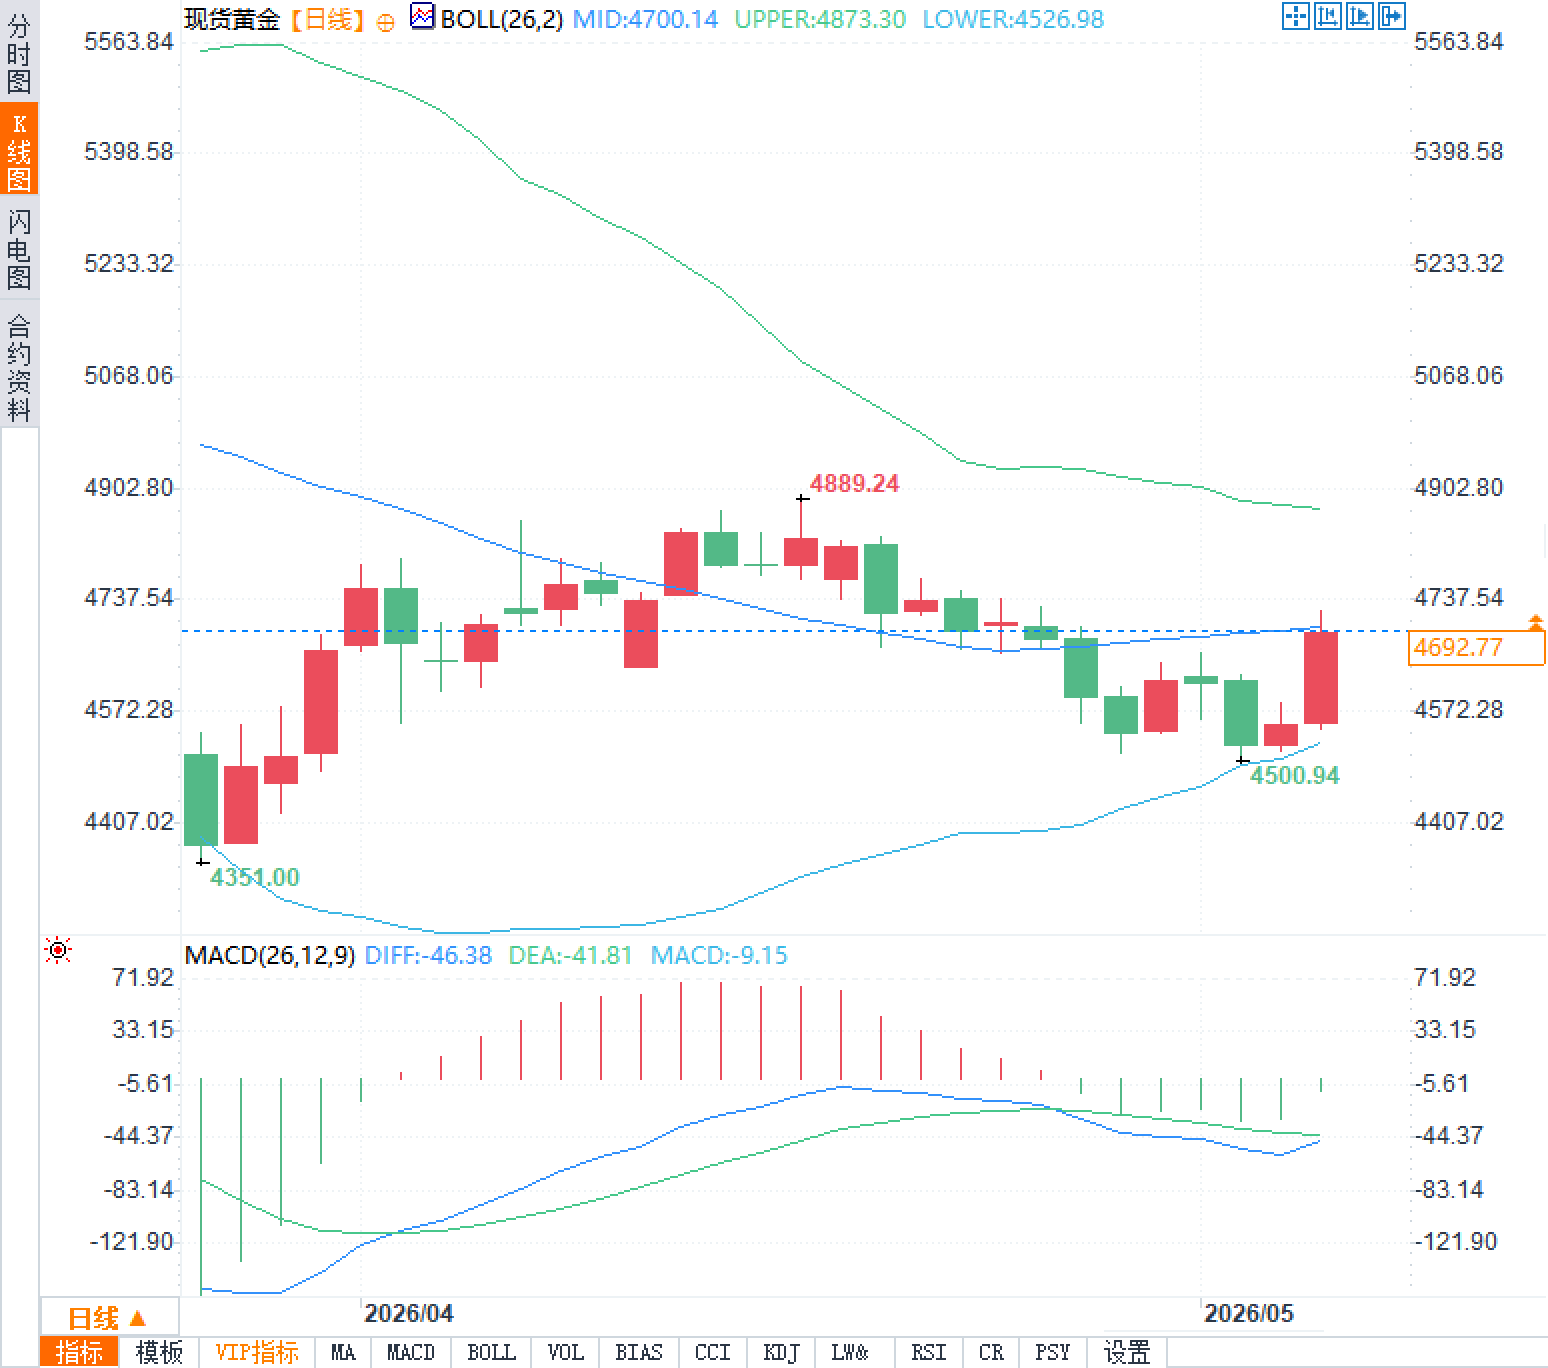
From the daily chart, gold has entered a range-bound trading pattern after retreating from its April highs. Today, it saw a clear rebound, currently trading around $4700. Overall, since April, prices have gradually declined from their highs, but support levels have steadily strengthened, particularly around $4500.94 where some buying interest has emerged. The current price is approaching the Bollinger Band's middle line, indicating a rebalancing of bullish and bearish forces in the short term.
The price is currently trading near the middle band. If it can hold above this level, it will open up room for further upward movement.
The US and Iran, through Pakistani mediation, are close to reaching a one-page memorandum to end the conflict in the Gulf region. This news directly led to a sharp drop in global oil prices, with Brent crude futures falling below $100 per barrel. High oil prices have been a major driver of inflation; once oil prices fall, overall price pressures ease, and the necessity for central banks to maintain high interest rates decreases accordingly. Although gold is a traditional inflation hedge, its non-interest-bearing nature in a high-interest-rate environment presents a significant opportunity cost; this geopolitical easing has precisely mitigated this contradiction.
Zaner Metals strategist Peter Grant recently noted, "Optimism surrounding a final US-Iran agreement has provided at least a short-term respite for gold, with low oil prices, easing inflation concerns, and a shift in bias toward the Fed's actions later this year playing a role. However, we cannot say we are completely out of the woods. The market will continue to fluctuate around Middle East headlines." This view captures the core driver of the current market: the gold rebound is more due to a shift in expectations than simply safe-haven demand. The US dollar index also fell by 0.5%, further amplifying gold's appeal.
Market focus quickly shifted to Friday's upcoming monthly U.S. jobs report. This data will be crucial in assessing economic resilience and the Federal Reserve's policy path. The ADP National Employment Report showed that private sector job growth in April exceeded expectations, indicating that the labor market remains relatively robust. This may support the Fed maintaining its current monetary policy stance, but if official non-farm payroll data shows signs of softening, it could reignite discussions about interest rate cuts.
In the current environment, gold prices are extremely sensitive to real yields and policy expectations. While strong employment data is a short-term negative for non-interest-bearing assets, the overall flexibility of interest rate paths has increased, coupled with downward revisions to inflation expectations due to easing geopolitical tensions. Traders generally believe that the interplay between macroeconomic data and geopolitical events is creating a complex game, and any unexpected reading could trigger significant volatility.
The Bollinger Bands are currently in a relatively narrowing state, with the middle band at $4700.14 serving as a key reference. The price approaching the middle band suggests potential increased short-term volatility, and traders should be wary of a potential breakout direction. The MACD (26,12,9) indicator shows a DIFF of -46.38, a DEA of -41.81, and a MACD histogram of -9.15, still in negative territory, but the histogram is showing a narrowing trend, suggesting that bearish momentum is gradually weakening. A subsequent golden cross signal would provide stronger confirmation for a rebound.
Combining candlestick patterns, the recent series of bullish candlesticks with interwoven shadows reflects a tug-of-war between bulls and bears, but today's rebound strength is relatively clear. Traders often use this type of indicator combination to judge the continuation of a trend and the probability of a reversal. The current combination shows an increased probability of a short-term rebound, but more confirmation signals are still needed to rule out the risk of a false breakout.
Spot gold price trend review
From the daily chart, gold has entered a range-bound trading pattern after retreating from its April highs. Today, it saw a clear rebound, currently trading around $4700. Overall, since April, prices have gradually declined from their highs, but support levels have steadily strengthened, particularly around $4500.94 where some buying interest has emerged. The current price is approaching the Bollinger Band's middle line, indicating a rebalancing of bullish and bearish forces in the short term.
| Key technology level | Value (USD/ounce) | Market implications |
|---|---|---|
| Bollinger Band Middle Rail | 4700.14 | Short-term fluctuations |
| upper rail | 4873.30 | Potential resistance to rebound |
| lower rail | 4526.98 | Main support area |
| recent highs | 4889.24 | Short-term target reference |
| Recent lows | 4500.94 | The effectiveness of this support needs to be verified. |
Geopolitical easing drives gold price rebound
The US and Iran, through Pakistani mediation, are close to reaching a one-page memorandum to end the conflict in the Gulf region. This news directly led to a sharp drop in global oil prices, with Brent crude futures falling below $100 per barrel. High oil prices have been a major driver of inflation; once oil prices fall, overall price pressures ease, and the necessity for central banks to maintain high interest rates decreases accordingly. Although gold is a traditional inflation hedge, its non-interest-bearing nature in a high-interest-rate environment presents a significant opportunity cost; this geopolitical easing has precisely mitigated this contradiction.
Zaner Metals strategist Peter Grant recently noted, "Optimism surrounding a final US-Iran agreement has provided at least a short-term respite for gold, with low oil prices, easing inflation concerns, and a shift in bias toward the Fed's actions later this year playing a role. However, we cannot say we are completely out of the woods. The market will continue to fluctuate around Middle East headlines." This view captures the core driver of the current market: the gold rebound is more due to a shift in expectations than simply safe-haven demand. The US dollar index also fell by 0.5%, further amplifying gold's appeal.
Employment data and monetary policy dynamics
Market focus quickly shifted to Friday's upcoming monthly U.S. jobs report. This data will be crucial in assessing economic resilience and the Federal Reserve's policy path. The ADP National Employment Report showed that private sector job growth in April exceeded expectations, indicating that the labor market remains relatively robust. This may support the Fed maintaining its current monetary policy stance, but if official non-farm payroll data shows signs of softening, it could reignite discussions about interest rate cuts.
In the current environment, gold prices are extremely sensitive to real yields and policy expectations. While strong employment data is a short-term negative for non-interest-bearing assets, the overall flexibility of interest rate paths has increased, coupled with downward revisions to inflation expectations due to easing geopolitical tensions. Traders generally believe that the interplay between macroeconomic data and geopolitical events is creating a complex game, and any unexpected reading could trigger significant volatility.
Technical Indicator Interpretation
The Bollinger Bands are currently in a relatively narrowing state, with the middle band at $4700.14 serving as a key reference. The price approaching the middle band suggests potential increased short-term volatility, and traders should be wary of a potential breakout direction. The MACD (26,12,9) indicator shows a DIFF of -46.38, a DEA of -41.81, and a MACD histogram of -9.15, still in negative territory, but the histogram is showing a narrowing trend, suggesting that bearish momentum is gradually weakening. A subsequent golden cross signal would provide stronger confirmation for a rebound.
Combining candlestick patterns, the recent series of bullish candlesticks with interwoven shadows reflects a tug-of-war between bulls and bears, but today's rebound strength is relatively clear. Traders often use this type of indicator combination to judge the continuation of a trend and the probability of a reversal. The current combination shows an increased probability of a short-term rebound, but more confirmation signals are still needed to rule out the risk of a false breakout.
Frequently Asked Questions
Question 1: Why did the news of the US-Iran peace agreement cause the price of spot gold to rise?
A: The peace agreement lowered oil prices to below $100 per barrel, directly alleviating inflationary pressures and weakening expectations of prolonged high interest rates. While gold is traditionally a safe haven, it faced pressure due to high opportunity costs in a high oil price and high inflation environment. This shift in expectations weakened the dollar and improved the monetary policy environment, becoming the core driver of the short-term rebound in gold prices.
Question 2: What does strong ADP employment data mean for gold?
A: The better-than-expected private sector employment figures in April indicate that the labor market remains resilient, which may delay the pace of interest rate cuts and put some pressure on gold. However, considering the easing of geopolitical tensions, if Friday's non-farm payroll data shows a marginal slowdown in the economy, it will balance expectations for the interest rate path, providing double support for gold. The market is currently in a sensitive period driven by data and news.
- Risk Warning and Disclaimer
- The market involves risk, and trading may not be suitable for all investors. This article is for reference only and does not constitute personal investment advice, nor does it take into account certain users’ specific investment objectives, financial situation, or other needs. Any investment decisions made based on this information are at your own risk.