Oil and stock markets move in tandem, a new test for the US dollar is on the horizon.
2026-05-06 21:43:58
On Wednesday, May 6th, the US dollar index came under rapid pressure and fell back, stabilizing around 98 during the North American session, down about 0.5% from the previous trading day's close. This movement is directly linked to market expectations of a possible easing of the US-Iran conflict. Latest news indicates that the US and Iran are close to reaching a one-page memorandum aimed at ending the current conflict or at least establishing a ceasefire framework to lay the foundation for subsequent nuclear negotiations. Although Iran has expressed reservations about some of the publicly released details, believing they reflect more of a unilateral will, the market has quickly priced in this possibility. Oil prices subsequently fell sharply, and US Treasury yields declined in tandem. Against this backdrop, the US dollar index lost some support, and traders are closely watching subsequent fundamental and technical developments.
The market's pricing in a de-escalation of the conflict quickly translated into the US dollar index. If the memorandum is implemented, it could gradually lift the blockade of the Strait of Hormuz, with expectations of a normalization in energy supply becoming the core driving factor. High energy prices had previously fueled global inflationary pressures, but the current decline directly alleviated this concern. Traders generally believe that lower energy costs will reduce the Federal Reserve's need to maintain high interest rates, thereby weakening the dollar's interest rate advantage. The 10-year US Treasury yield has fallen to around 4.36%, showing a clear correlation with oil price movements. In this environment, the US dollar index lost its safe-haven premium and weakened against major currencies. It is worth noting that this de-escalation does not completely eliminate the nuclear issue, but rather opens a window for deeper negotiations; therefore, the market remains cautious, but overall risk appetite has increased.
Significant adjustments in energy prices directly impact inflation expectations. A drop of around $10 per barrel in oil prices typically has a transmission effect on the US Consumer Price Index (CPI) that takes several months to materialize, especially given the recent decline in gasoline prices from a high of $4.53 per gallon. This change weakens the attractiveness of the US dollar as a high-interest-rate asset. Consequently, Federal Reserve policy expectations have been slightly adjusted, and market pricing in a prolonged high-interest-rate environment has softened. The US dollar index faces dual pressures in this process: firstly, declining expectations of real interest rates, and secondly, increased attractiveness of risk assets leading to capital outflows from the dollar. Traders are focusing on whether deleveraging in the energy market will continue and the impact of this process on global capital flows. The fundamental logic is clear: lower energy costs are beneficial to growth expectations, but their short-term support for the dollar is limited, especially given the rapid decline in risk aversion.
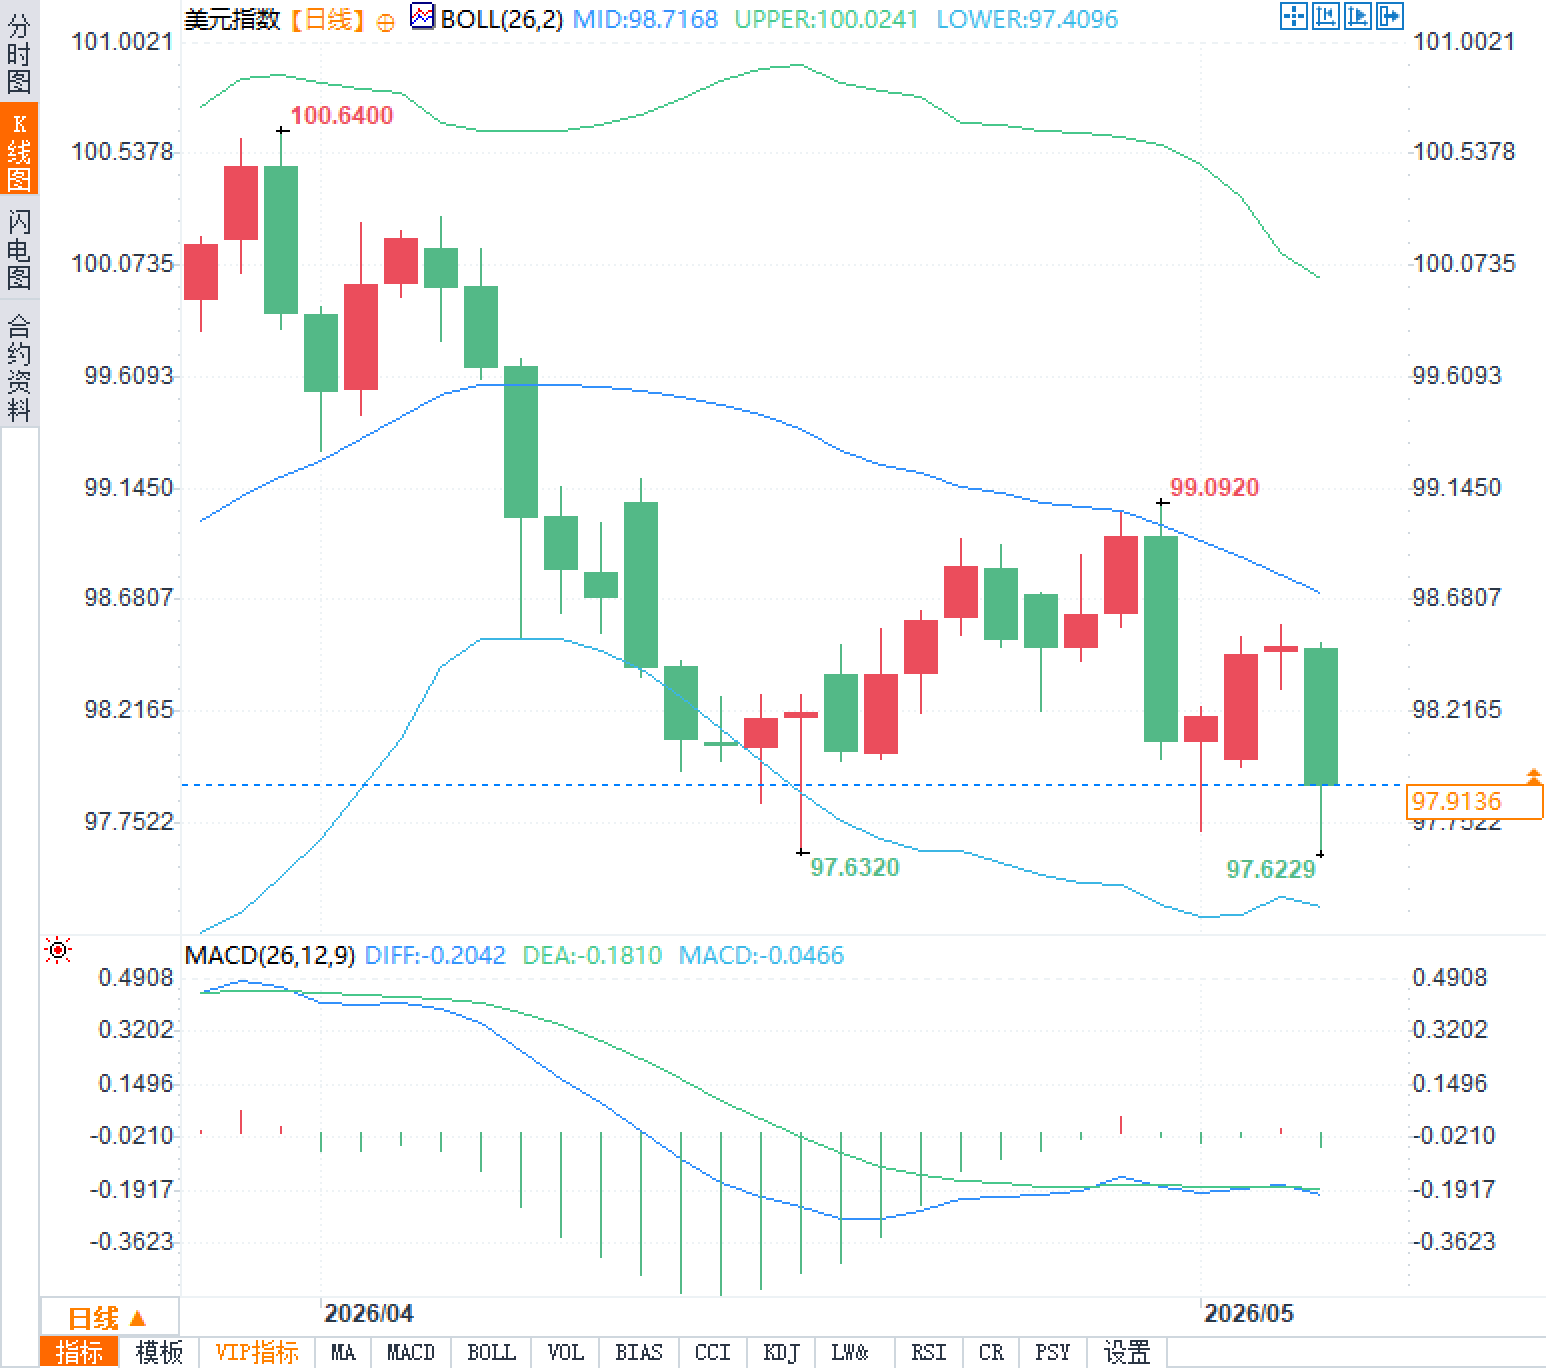
From the daily chart, the US dollar index is currently testing the lower Bollinger Band, with the middle band at 98.72, the upper band at 100.02, and the lower band at 97.41. The price has repeatedly touched the lower band and experienced slight rebounds, but overall remains within the lower half of the channel. The MACD indicator shows a DIFF value of -0.2042, a DEA value of -0.1810, and the MACD histogram in negative territory, indicating weak short-term momentum. A decisive break below the 97.41 lower band would open up further downside potential; conversely, a hold above the middle band could lead to a technical correction. Technical and fundamental factors are converging, indicating significant downward pressure, but oversold signals also suggest a potential short-term rebound. Overall, the indicator combination suggests a cautiously bearish trend.
The direct impact of geopolitical easing on the US dollar index
The market's pricing in a de-escalation of the conflict quickly translated into the US dollar index. If the memorandum is implemented, it could gradually lift the blockade of the Strait of Hormuz, with expectations of a normalization in energy supply becoming the core driving factor. High energy prices had previously fueled global inflationary pressures, but the current decline directly alleviated this concern. Traders generally believe that lower energy costs will reduce the Federal Reserve's need to maintain high interest rates, thereby weakening the dollar's interest rate advantage. The 10-year US Treasury yield has fallen to around 4.36%, showing a clear correlation with oil price movements. In this environment, the US dollar index lost its safe-haven premium and weakened against major currencies. It is worth noting that this de-escalation does not completely eliminate the nuclear issue, but rather opens a window for deeper negotiations; therefore, the market remains cautious, but overall risk appetite has increased.
The correlation between falling energy prices and expectations of Federal Reserve policy
Significant adjustments in energy prices directly impact inflation expectations. A drop of around $10 per barrel in oil prices typically has a transmission effect on the US Consumer Price Index (CPI) that takes several months to materialize, especially given the recent decline in gasoline prices from a high of $4.53 per gallon. This change weakens the attractiveness of the US dollar as a high-interest-rate asset. Consequently, Federal Reserve policy expectations have been slightly adjusted, and market pricing in a prolonged high-interest-rate environment has softened. The US dollar index faces dual pressures in this process: firstly, declining expectations of real interest rates, and secondly, increased attractiveness of risk assets leading to capital outflows from the dollar. Traders are focusing on whether deleveraging in the energy market will continue and the impact of this process on global capital flows. The fundamental logic is clear: lower energy costs are beneficial to growth expectations, but their short-term support for the dollar is limited, especially given the rapid decline in risk aversion.
US Dollar Index Technical Analysis
From the daily chart, the US dollar index is currently testing the lower Bollinger Band, with the middle band at 98.72, the upper band at 100.02, and the lower band at 97.41. The price has repeatedly touched the lower band and experienced slight rebounds, but overall remains within the lower half of the channel. The MACD indicator shows a DIFF value of -0.2042, a DEA value of -0.1810, and the MACD histogram in negative territory, indicating weak short-term momentum. A decisive break below the 97.41 lower band would open up further downside potential; conversely, a hold above the middle band could lead to a technical correction. Technical and fundamental factors are converging, indicating significant downward pressure, but oversold signals also suggest a potential short-term rebound. Overall, the indicator combination suggests a cautiously bearish trend.
Frequently Asked Questions
Question 1: Why did the ceasefire framework announcement directly cause the US dollar index to fall?
A: The memo broke the safe-haven premium previously driven by the escalation of the conflict, causing oil prices to fall rapidly, reducing inflation expectations, and US Treasury yields to decline in tandem, weakening the attractiveness of the US dollar. At the same time, a rise in risk appetite prompted funds to shift to assets such as stocks, temporarily weakening the dollar's role as a safe haven. This interconnected effect manifested in the foreign exchange market as the US dollar index coming under rapid pressure, with traders quickly adjusting their positions through cross-asset pricing.
Question 2: What is the long-term positioning of the US dollar index in the context of falling oil prices?
A: The normalization of energy prices will gradually alleviate global inflationary pressures, and the Federal Reserve will have greater policy flexibility. However, the US dollar will remain influenced by the US economic fundamentals and global capital flows in the long term. In the short term, increased risk appetite is unfavorable for the dollar, while in the medium to long term, it depends on the comparison between interest rate differentials and growth expectations. Traders are closely monitoring the deleveraging process in the energy market and the progress of subsequent nuclear negotiations to determine whether the dollar can break free from its current pressure range.
- Risk Warning and Disclaimer
- The market involves risk, and trading may not be suitable for all investors. This article is for reference only and does not constitute personal investment advice, nor does it take into account certain users’ specific investment objectives, financial situation, or other needs. Any investment decisions made based on this information are at your own risk.