


A UBS report reveals the truth behind the dollar's rebound; traders are watching two key support levels.
2026-05-13 17:57:52
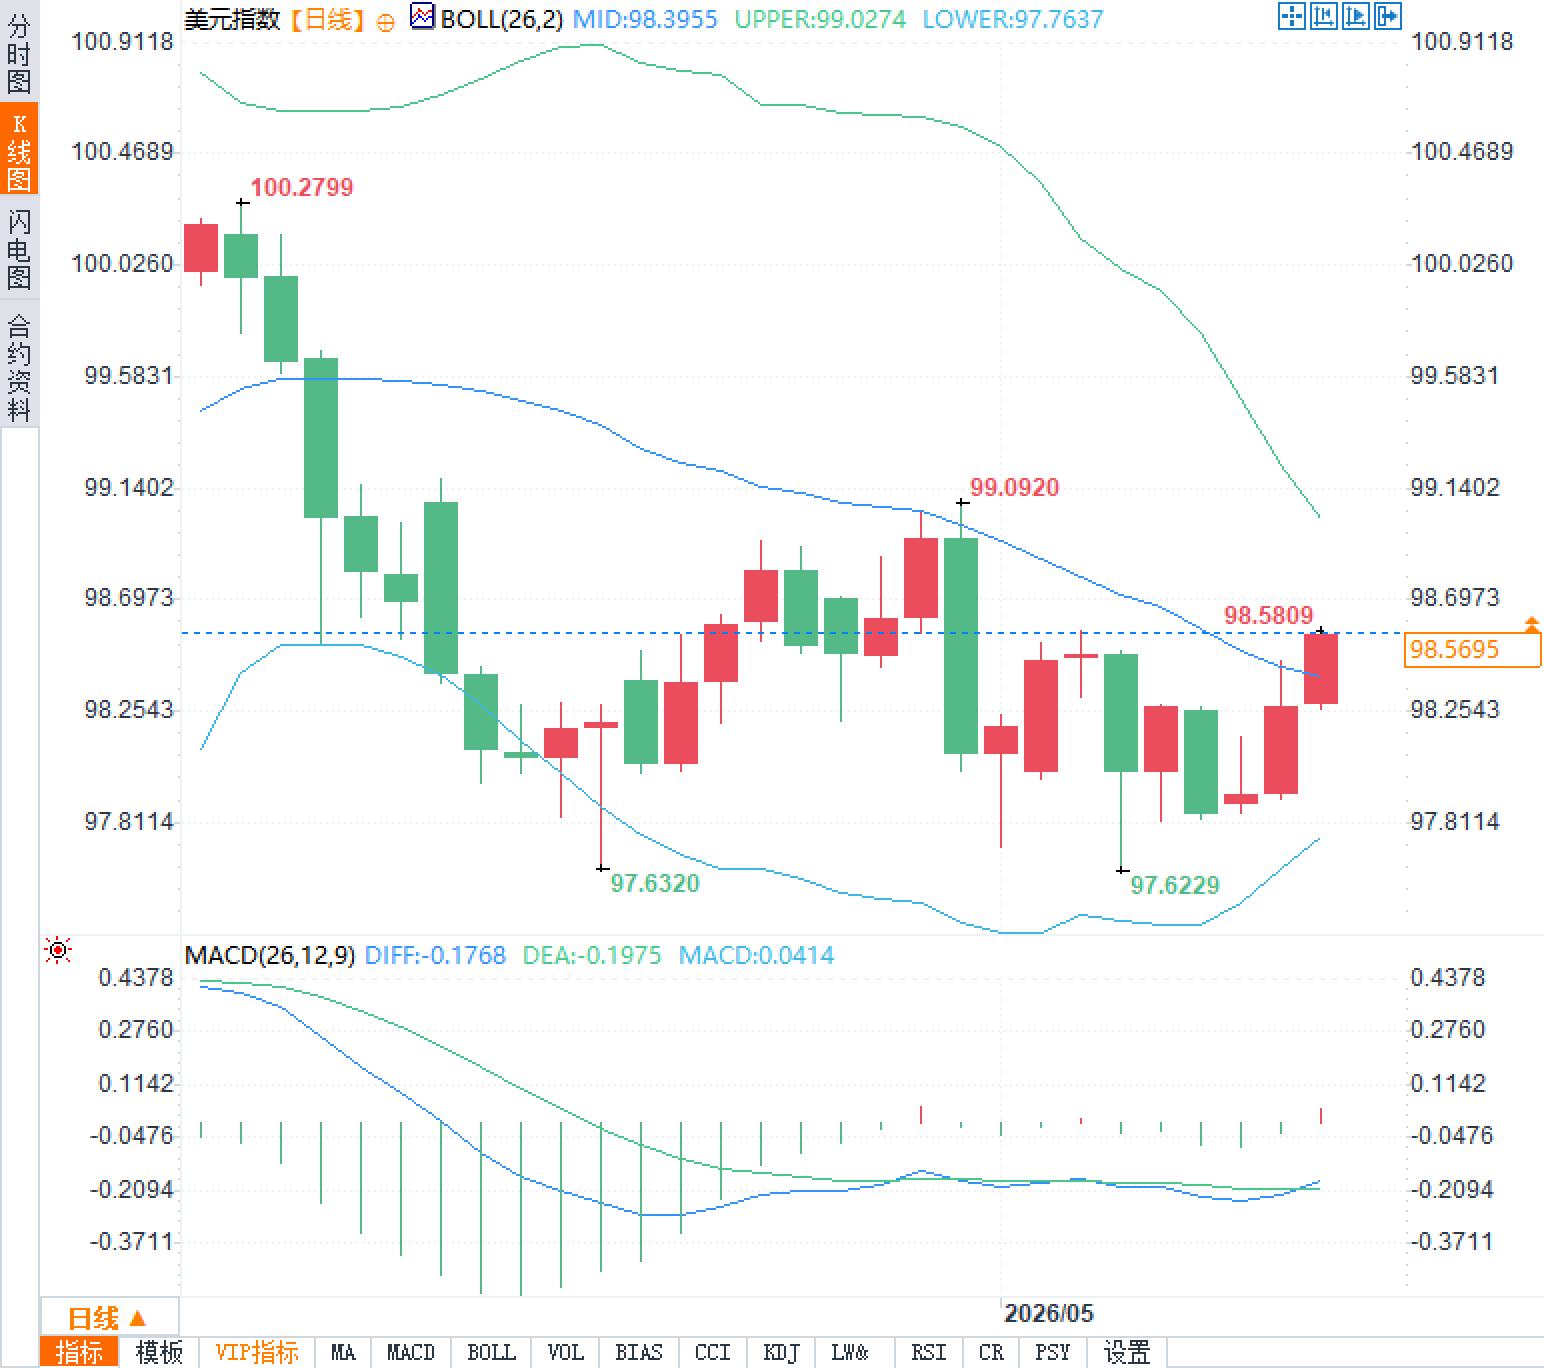
On Wednesday, May 13th, the US dollar index maintained its rebound on the daily chart, reaching near 98.57 during the European session. The chart shows the index gradually retreated from a high of 100.2799 to a low of 97.6229 before rebounding slightly. Against this backdrop, UBS's latest report significantly postponed the Fed's rate cut timeline, aligning with the adjustments made by several other institutions.
Previously, the market generally believed that there would be at least two 25-basis-point rate cuts in 2026, but the latest assessment points to December 2026 and March 2027. In April, the US Consumer Price Index rose to a three-year high year-on-year, with energy inflation contributing over 40%. This, coupled with the Iranian conflict entering its 11th week and pushing up oil prices, and the better-than-expected non-farm payroll data and a stable unemployment rate of 4.3% in April, collectively reinforced the constraints of persistent inflation and economic resilience on monetary policy.

The daily chart for the US Dollar Index shows the Bollinger Bands (26,2) with the middle band at 98.3955, the upper band at 99.0274, and the lower band at 97.7637. The latest price of 98.5695 is near the middle band, indicating a relatively narrowing trading range. The MACD (26,12,9) indicator shows a DIFF of -0.1768, a DEA of -0.1975, and a MACD value of 0.0414. The histogram is slightly positive, indicating that short-term selling pressure has eased somewhat, but overall momentum remains weak. The candlestick pattern shows alternating green and red bars, with a rebound after a low of 97.6320. Significant resistance was encountered at 98.5809, while the 99.0920 area represents previous high resistance. Traders are watching the effectiveness of the support level at 98.25 and the difficulty of breaking through the upper band at 99.0274. Overall, the technical picture shows a volatile trend, with limited short-term rebound strength. The continuation of the trend needs to be verified by fundamental data.
In its latest report, UBS explicitly stated that the core conditions for a September rate cut—persistent commodity deflation and reduced supply chain uncertainty—have not yet been met. Furthermore, economic growth and labor market resilience have reduced the urgency for policy easing. The institution has revised its previous forecast of 25 basis point rate cuts each in September and December 2026 to 25 basis point cuts each in December 2026 and March 2027. This shift is highly consistent with market pricing; the CME FedWatch tool shows an approximately 87.4% probability of no rate cut in September. The simultaneous postponement of easing expectations by multiple institutions reflects policymakers' cautious assessment of the inflation decline path. Delaying rate cuts means that the federal funds rate will remain in the current target range of 3.50-3.75% in the short term, thereby affecting the relative attractiveness of the dollar and the pace of global capital flows.
The US Consumer Price Index (CPI) rose to a three-year high year-on-year in April, with the month-on-month increase also exceeding expectations. Energy inflation contributed over 40% of this increase, directly driven by a significant rise in oil prices. The ongoing conflict in Iran, lasting 11 weeks with no signs of a ceasefire, has increased uncertainty in energy supply, keeping Brent crude oil prices high and further amplifying overall inflationary pressures. Energy costs are being passed on to gasoline, transportation, and manufacturing sectors, creating a chain reaction, and core inflation is falling more slowly than initially expected. Traders are closely watching the impact of energy price fluctuations on subsequent monthly CPI data and whether this will force policymakers to extend the tightening cycle.
April's non-farm payroll data was strong, with job creation exceeding market expectations and the unemployment rate remaining stable at 4.3%, indicating significant resilience in the labor market. Robust job growth and wage levels reduced concerns about an overly slowing economy and lessened the need for the Federal Reserve to ease monetary policy prematurely before inflationary pressures have fully subsided. This data, coupled with rising inflation, supports institutions' revised assessments of the policy path. Traders need to continue monitoring subsequent employment reports and wage data to assess the probability of a soft landing and its transmission effect on exchange rates.
Previously, the market generally believed that there would be at least two 25-basis-point rate cuts in 2026, but the latest assessment points to December 2026 and March 2027. In April, the US Consumer Price Index rose to a three-year high year-on-year, with energy inflation contributing over 40%. This, coupled with the Iranian conflict entering its 11th week and pushing up oil prices, and the better-than-expected non-farm payroll data and a stable unemployment rate of 4.3% in April, collectively reinforced the constraints of persistent inflation and economic resilience on monetary policy.
Technical Analysis of the US Dollar Index
The daily chart for the US Dollar Index shows the Bollinger Bands (26,2) with the middle band at 98.3955, the upper band at 99.0274, and the lower band at 97.7637. The latest price of 98.5695 is near the middle band, indicating a relatively narrowing trading range. The MACD (26,12,9) indicator shows a DIFF of -0.1768, a DEA of -0.1975, and a MACD value of 0.0414. The histogram is slightly positive, indicating that short-term selling pressure has eased somewhat, but overall momentum remains weak. The candlestick pattern shows alternating green and red bars, with a rebound after a low of 97.6320. Significant resistance was encountered at 98.5809, while the 99.0920 area represents previous high resistance. Traders are watching the effectiveness of the support level at 98.25 and the difficulty of breaking through the upper band at 99.0274. Overall, the technical picture shows a volatile trend, with limited short-term rebound strength. The continuation of the trend needs to be verified by fundamental data.
The Federal Reserve's monetary policy expectations have been significantly postponed.
In its latest report, UBS explicitly stated that the core conditions for a September rate cut—persistent commodity deflation and reduced supply chain uncertainty—have not yet been met. Furthermore, economic growth and labor market resilience have reduced the urgency for policy easing. The institution has revised its previous forecast of 25 basis point rate cuts each in September and December 2026 to 25 basis point cuts each in December 2026 and March 2027. This shift is highly consistent with market pricing; the CME FedWatch tool shows an approximately 87.4% probability of no rate cut in September. The simultaneous postponement of easing expectations by multiple institutions reflects policymakers' cautious assessment of the inflation decline path. Delaying rate cuts means that the federal funds rate will remain in the current target range of 3.50-3.75% in the short term, thereby affecting the relative attractiveness of the dollar and the pace of global capital flows.
Analysis of Inflationary Pressures and Energy Market Shocks
The US Consumer Price Index (CPI) rose to a three-year high year-on-year in April, with the month-on-month increase also exceeding expectations. Energy inflation contributed over 40% of this increase, directly driven by a significant rise in oil prices. The ongoing conflict in Iran, lasting 11 weeks with no signs of a ceasefire, has increased uncertainty in energy supply, keeping Brent crude oil prices high and further amplifying overall inflationary pressures. Energy costs are being passed on to gasoline, transportation, and manufacturing sectors, creating a chain reaction, and core inflation is falling more slowly than initially expected. Traders are closely watching the impact of energy price fluctuations on subsequent monthly CPI data and whether this will force policymakers to extend the tightening cycle.
| Economic data | Latest values in April | Market impact |
|---|---|---|
| Consumer Price Index Year-on-Year | Three-year high | Energy contribution exceeds 40% |
| Non-farm payrolls growth | Exceeding expectations | Labor market resilience |
| unemployment rate | 4.3% | Stable without rising |
Reduced Labor Market Resilience and the Urgency of Easing
April's non-farm payroll data was strong, with job creation exceeding market expectations and the unemployment rate remaining stable at 4.3%, indicating significant resilience in the labor market. Robust job growth and wage levels reduced concerns about an overly slowing economy and lessened the need for the Federal Reserve to ease monetary policy prematurely before inflationary pressures have fully subsided. This data, coupled with rising inflation, supports institutions' revised assessments of the policy path. Traders need to continue monitoring subsequent employment reports and wage data to assess the probability of a soft landing and its transmission effect on exchange rates.
Frequently Asked Questions
Question 1: Why has the expectation of a Federal Reserve rate cut been significantly postponed from September 2026 to December?
A: UBS's latest report clearly points out that the Consumer Price Index (CPI) rose to a three-year high in April, with energy inflation contributing over 40%, core commodity deflation progressing slowly, and supply chain uncertainty remaining. Meanwhile, strong employment data in April and a stable unemployment rate of 4.3% demonstrate the resilience of economic growth, making a September rate cut premature. Currently, the market prices an 87.4% probability of no rate cut in September. This adjustment reflects policymakers' cautious attitude towards the path of inflation decline, avoiding the risk of double-dip inflation triggered by premature easing.
Question 2: What is the transmission mechanism of the Iranian conflict on inflation and the US dollar index?
A: The conflict, now in its 11th week, has pushed up oil prices, directly contributing over 40% to April's energy inflation and accelerating the year-on-year consumer price index to a three-year high. Energy costs are being passed on to manufacturing and consumption, slowing the overall decline in inflation and reinforcing the Federal Reserve's need to maintain high interest rates. This has provided some support for the US dollar index, but we should be wary of the potential negative impact of further oil price spikes triggering concerns about global demand.
- Risk Warning and Disclaimer
- The market involves risk, and trading may not be suitable for all investors. This article is for reference only and does not constitute personal investment advice, nor does it take into account certain users’ specific investment objectives, financial situation, or other needs. Any investment decisions made based on this information are at your own risk.
