A sneak attack or a full-scale assault? Gold holds its mid-range level, US oil awaits favorable conditions, and the US dollar is sharpening its knives: the final battle script has been leaked ahead of time!
2026-05-14 20:20:40
On Thursday (May 14), US oil, gold, the US dollar index, and US Treasury yields showed a divergent pattern. The US dollar index continued its rebound, stabilizing above 98.55, boosted by rising US inflation data and expectations of a Fed rate hike; the 10-year US Treasury yield saw a short-term pullback, touching around 4.444 during the session; US oil remained in a narrow range above $100 due to geopolitical factors; gold fluctuated around the $4700 level, exhibiting a wide range of fluctuations overall. Cross-market correlations show that the current market focus is on the phased divergence between the US dollar and yields, as well as the geopolitical premium of oil prices. Today's news of Trump's visit to China provided some support for risk assets, but the inflation path and policy expectations remain the dominant variables. Overall, the market is seeking a balance between policy signals and supply and demand disturbances, and short-term volatility has increased.
Latest economic data shows a significant rise in the US Producer Price Index (PPI), which, combined with consumer price data, has boosted market expectations for a tightening of Federal Reserve policy. This has supported the US dollar index, which is expected to maintain a slightly bullish trend in the short term. Reports from well-known foreign media outlets indicate that the market still prices the June FOMC meeting unchanged interest rates, but the probability of a December rate hike has clearly increased. This corresponds to the US dollar index's movement within the Bollinger Bands' middle to upper band range, near the 98.60-98.74 resistance zone.
For US oil, geopolitical tensions remain the core driver. Disruptions to traffic in the Strait of St. Hormuz, coupled with some shipping incidents, have pushed oil prices above $100. Despite statements from both sides agreeing to keep the strait open during meetings, actual traffic volume remains below historical averages, supporting the rebound in oil prices. US Treasury yields, influenced by expectations of interest rate hikes, have reached a relatively high level. The 10-year yield, after previously hitting a new high, has seen a short-term pullback, reflecting the market's struggle between inflation concerns and policy direction. Overall, the fundamentals indicate that inflation and geopolitical factors are jointly shaping the current cross-market environment, with a strong dollar and resilient oil prices moving in tandem.
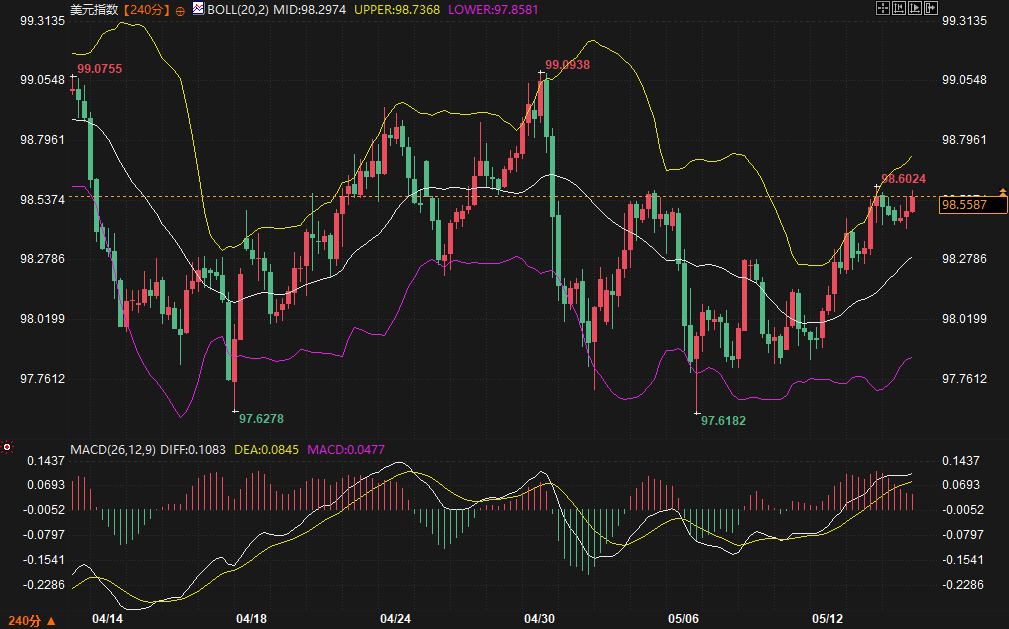
From a technical perspective, different instruments show a clear divergence. The US dollar index is currently quoted at 98.5587, trading between the Bollinger Band middle line (98.30) and the upper line (98.74). The MACD histogram is showing a slight increase in bullish momentum, with the DIFF line crossing above the DEA line, indicating a slight advantage for the bulls, but limited upside potential. The 98.60-98.74 area forms short-term resistance, while 98.30 provides initial support.
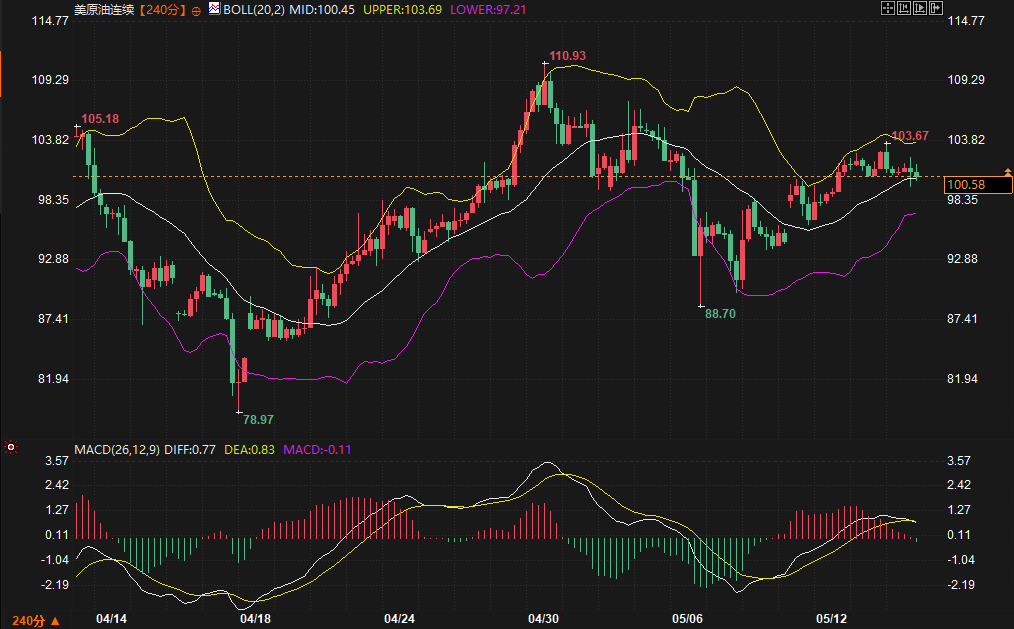
US crude oil futures are currently trading around 100.58, closely following the Bollinger Band middle line at 100.45. The upper Bollinger Band at 103.69 presents significant resistance, while the lower Bollinger Band at 97.21 serves as medium-term support. The MACD indicator shows the DIFF and DEA lines nearly converging, with extremely short green bars, indicating a balance between buyers and sellers. This suggests that the short-term direction awaits further confirmation from fundamental signals. The price is currently in a rebound and correction phase, with the middle Bollinger Band providing effective support.
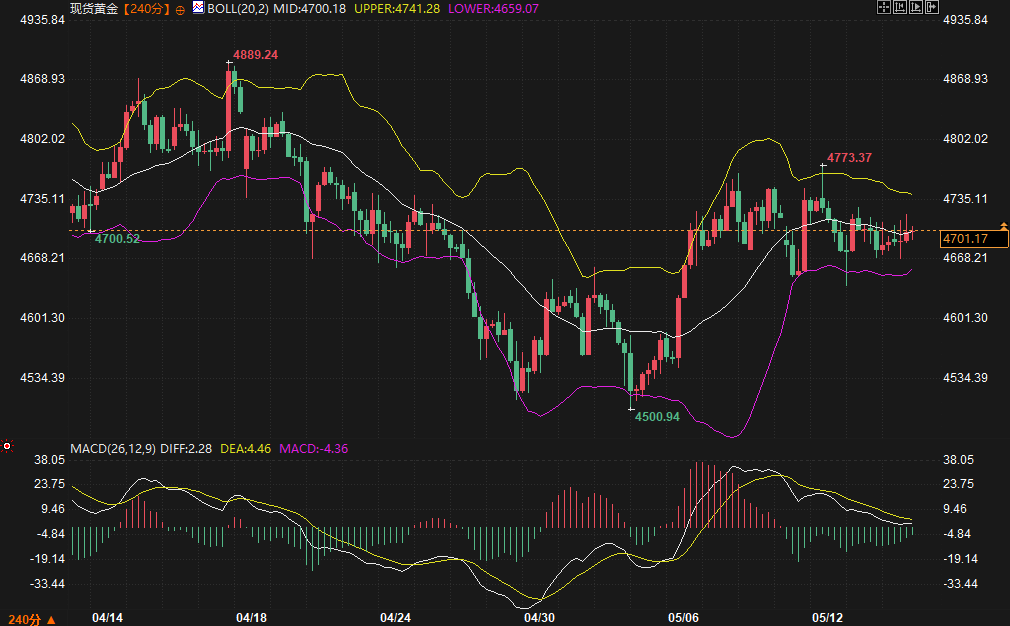
Gold is currently priced at 4701.17, near the middle Bollinger Band at 4700.18, with the upper band at 4741 and the lower band at 4659 forming a trading range. The MACD histogram continues to expand, but the absolute value is narrowing, indicating weakening downward momentum. This suggests that short-term bears are in control, but a sustained downward trend is unlikely.
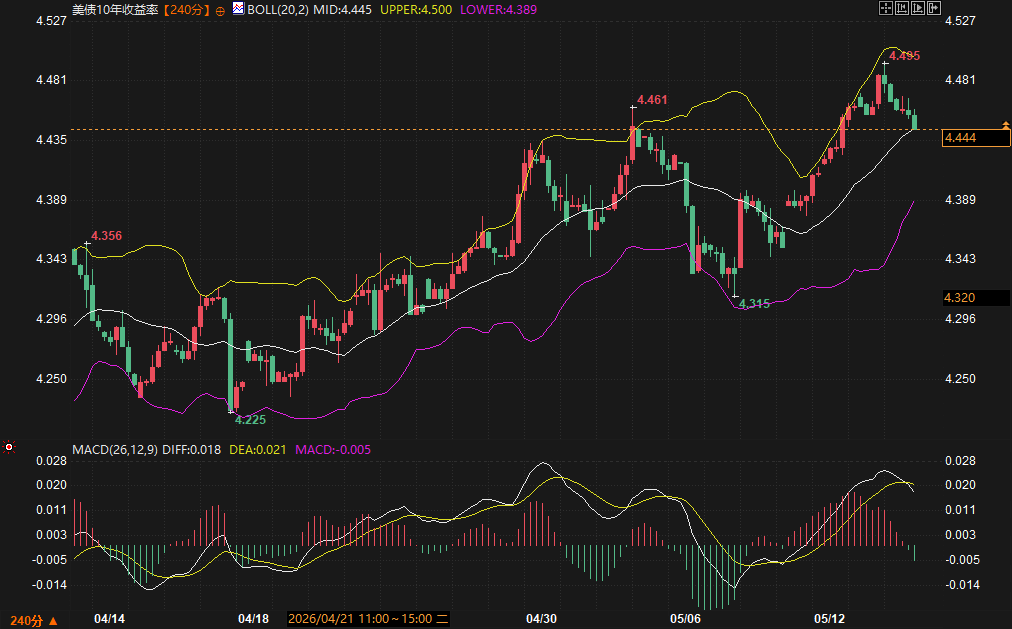
The 10-year US Treasury yield was 4.444%, just breaking below the Bollinger Band middle line at 4.445. Previously, it was trading near the upper Bollinger Band. The MACD has turned from red to green, indicating weakening short-term bullish momentum. The middle Bollinger Band at 4.445 and the lower Bollinger Band at 4.389 provide potential support. The upper Bollinger Band at 4.500 is a significant resistance level.
A stronger US dollar index has a clear ripple effect on other assets. A stronger dollar typically puts downward pressure on gold, and the current gold price is closely hovering around the middle band, consistent with the MACD histogram's bearish trend. Meanwhile, the high-yield environment enhances the attractiveness of holding dollar-denominated assets, further solidifying the dollar index's position above 98.50.
The correlation between US oil and the US dollar has shown a phased divergence. Geopolitical premiums give oil prices relatively independent resilience, but if the dollar continues to strengthen and expectations of interest rate hikes intensify, it may indirectly constrain oil prices through global demand expectations. The pullback in US Treasury yields has provided a temporary respite for the dollar, indicating a dynamic balance in the market between inflation trades and growth concerns. Data shows that cross-market correlations have increased, and any marginal changes in policy or geopolitical signals could amplify the linkage effect.
Data from the Treasury bond financing market shows that GC opened 5 basis points lower than the previous day's close at 3.59%, mainly driven by a low TGA balance and relatively ample cash within the system. Coupled with a large-scale capital outflow expected tomorrow, the market anticipates a probability of a rebound in financing rates. RRP operation data shows moderate participation, and combined with SOFR futures and OIS pricing, the short-term liquidity environment is generally stable, but the policy path driven by inflation expectations remains a major variable. This funding background provides micro-level support for US Treasury yields and the dollar's performance and needs to be incorporated into a cross-market analysis framework.
Based on both fundamental and technical signals, the market is expected to remain range-bound over the next 2-3 days, with attention focused on key levels for confirmation. The US dollar index is likely to maintain a slightly bullish bias within the 98.30-98.74 range; if interest rate hike expectations intensify further, it may test the upper resistance level. US oil is seeking support above $100, with resistance around $103.69 and support in the $97-$100 range; geopolitical news remains a major catalyst. Gold will continue to fluctuate between $4659 and $4741, with the $4700 level being a key point to watch. The 10-year US Treasury yield still faces short-term pullback risks, with support at 4.389-4.445; a break above 4.500 is needed to confirm a continuation of the trend.
The overall logic is consistent: the inflation path dominates the pricing of the US dollar and yields, geopolitical factors provide oil prices with periodic resilience, and gold seeks a balance between safe-haven appeal and dollar suppression. The market will continue to assess the aftermath of the meeting and liquidity dynamics. Volatility is expected to remain at current levels, but attention should be paid to the potential disruptions to the correlation caused by marginal changes in data or news.
What are the main drivers of the current strength of the US dollar index?
The recent rebound in the US dollar index is mainly due to better-than-expected US inflation data and an increased probability of a Federal Reserve rate hike. Producer price index and other data have increased market pricing in policy tightening. Technically, the price is trading between the middle and upper Bollinger Bands, with the MACD histogram showing a slight increase in bullish momentum, indicating that bulls are in control but the momentum has not yet been fully released. In the next 2-3 days, the 98.60-98.74 area will be a key resistance level, and the evolution of inflation expectations needs to be observed.
Can the current price of US crude oil remain above $100?
US crude oil is priced around 100.58, with the Bollinger Band middle line providing significant support. Geopolitical factors, especially developments related to the Strait of Hormuz, form the basis for price resilience. The MACD is in a balanced state, and the short-term direction depends on news confirmation. Upward resistance is at 103.69, while downward support is at 97.21. The consensus reached during the meeting regarding the opening of the Strait has had a stabilizing effect on market sentiment, but the actual passage situation still needs to be monitored.
What factors influence the price movement of gold?
Gold is currently trading close to the Bollinger Band middle line around 4700. The MACD histogram is showing signs of weakening but the momentum is waning, indicating a range-bound market. A stronger US dollar is providing significant resistance, while the yield environment is also impacting its safe-haven appeal. The short-term range is expected to be 4659-4741, with the middle line being a key level to watch. Wide-range fluctuations are anticipated over the next 2-3 days; close attention should be paid to the correlation between the US dollar and yields.
What impact will the pullback in US Treasury yields have on the overall market?
The 10-year yield was 4.444%, briefly breaking below the Bollinger Band middle line. The MACD turned from red to green, indicating a temporary weakening of bullish momentum. Downside support is seen in the 4.389-4.445 area. This pullback provides some breathing room for the US dollar and alleviates some financing pressure on assets, but inflation expectations still limit the downside potential of yields. From a cross-market perspective, the divergence between yields and the US dollar warrants continued attention.
What are the key points to observe regarding cross-market collaboration in the next 2-3 days?
Key focus areas include the interaction between the US dollar and yields, the persistence of the geopolitical premium in US oil, and changes in gold's sensitivity to the US dollar. On the funding front, dynamics in GC funding rates and SOFR pricing also provide supplementary signals. Overall, range-bound trading is highly probable, and any marginal changes in inflation data, geopolitical developments, or policy statements could trigger cascading adjustments. Investors should remain cautious and observe the effectiveness of key support and resistance levels in light of their own risk appetite.
Fundamental Environment: A Mixture of Inflationary Pressures and Geopolitical Factors
Latest economic data shows a significant rise in the US Producer Price Index (PPI), which, combined with consumer price data, has boosted market expectations for a tightening of Federal Reserve policy. This has supported the US dollar index, which is expected to maintain a slightly bullish trend in the short term. Reports from well-known foreign media outlets indicate that the market still prices the June FOMC meeting unchanged interest rates, but the probability of a December rate hike has clearly increased. This corresponds to the US dollar index's movement within the Bollinger Bands' middle to upper band range, near the 98.60-98.74 resistance zone.
For US oil, geopolitical tensions remain the core driver. Disruptions to traffic in the Strait of St. Hormuz, coupled with some shipping incidents, have pushed oil prices above $100. Despite statements from both sides agreeing to keep the strait open during meetings, actual traffic volume remains below historical averages, supporting the rebound in oil prices. US Treasury yields, influenced by expectations of interest rate hikes, have reached a relatively high level. The 10-year yield, after previously hitting a new high, has seen a short-term pullback, reflecting the market's struggle between inflation concerns and policy direction. Overall, the fundamentals indicate that inflation and geopolitical factors are jointly shaping the current cross-market environment, with a strong dollar and resilient oil prices moving in tandem.
Technical signals: Support and resistance zones resonate with indicators
From a technical perspective, different instruments show a clear divergence. The US dollar index is currently quoted at 98.5587, trading between the Bollinger Band middle line (98.30) and the upper line (98.74). The MACD histogram is showing a slight increase in bullish momentum, with the DIFF line crossing above the DEA line, indicating a slight advantage for the bulls, but limited upside potential. The 98.60-98.74 area forms short-term resistance, while 98.30 provides initial support.
US crude oil futures are currently trading around 100.58, closely following the Bollinger Band middle line at 100.45. The upper Bollinger Band at 103.69 presents significant resistance, while the lower Bollinger Band at 97.21 serves as medium-term support. The MACD indicator shows the DIFF and DEA lines nearly converging, with extremely short green bars, indicating a balance between buyers and sellers. This suggests that the short-term direction awaits further confirmation from fundamental signals. The price is currently in a rebound and correction phase, with the middle Bollinger Band providing effective support.
Gold is currently priced at 4701.17, near the middle Bollinger Band at 4700.18, with the upper band at 4741 and the lower band at 4659 forming a trading range. The MACD histogram continues to expand, but the absolute value is narrowing, indicating weakening downward momentum. This suggests that short-term bears are in control, but a sustained downward trend is unlikely.
The 10-year US Treasury yield was 4.444%, just breaking below the Bollinger Band middle line at 4.445. Previously, it was trading near the upper Bollinger Band. The MACD has turned from red to green, indicating weakening short-term bullish momentum. The middle Bollinger Band at 4.445 and the lower Bollinger Band at 4.389 provide potential support. The upper Bollinger Band at 4.500 is a significant resistance level.
Cross-market linkage: Asset pricing under a strong dollar
A stronger US dollar index has a clear ripple effect on other assets. A stronger dollar typically puts downward pressure on gold, and the current gold price is closely hovering around the middle band, consistent with the MACD histogram's bearish trend. Meanwhile, the high-yield environment enhances the attractiveness of holding dollar-denominated assets, further solidifying the dollar index's position above 98.50.
The correlation between US oil and the US dollar has shown a phased divergence. Geopolitical premiums give oil prices relatively independent resilience, but if the dollar continues to strengthen and expectations of interest rate hikes intensify, it may indirectly constrain oil prices through global demand expectations. The pullback in US Treasury yields has provided a temporary respite for the dollar, indicating a dynamic balance in the market between inflation trades and growth concerns. Data shows that cross-market correlations have increased, and any marginal changes in policy or geopolitical signals could amplify the linkage effect.
Funding Situation Observation: Financing Rates and Liquidity Disturbances
Data from the Treasury bond financing market shows that GC opened 5 basis points lower than the previous day's close at 3.59%, mainly driven by a low TGA balance and relatively ample cash within the system. Coupled with a large-scale capital outflow expected tomorrow, the market anticipates a probability of a rebound in financing rates. RRP operation data shows moderate participation, and combined with SOFR futures and OIS pricing, the short-term liquidity environment is generally stable, but the policy path driven by inflation expectations remains a major variable. This funding background provides micro-level support for US Treasury yields and the dollar's performance and needs to be incorporated into a cross-market analysis framework.
Trend Outlook
Based on both fundamental and technical signals, the market is expected to remain range-bound over the next 2-3 days, with attention focused on key levels for confirmation. The US dollar index is likely to maintain a slightly bullish bias within the 98.30-98.74 range; if interest rate hike expectations intensify further, it may test the upper resistance level. US oil is seeking support above $100, with resistance around $103.69 and support in the $97-$100 range; geopolitical news remains a major catalyst. Gold will continue to fluctuate between $4659 and $4741, with the $4700 level being a key point to watch. The 10-year US Treasury yield still faces short-term pullback risks, with support at 4.389-4.445; a break above 4.500 is needed to confirm a continuation of the trend.
The overall logic is consistent: the inflation path dominates the pricing of the US dollar and yields, geopolitical factors provide oil prices with periodic resilience, and gold seeks a balance between safe-haven appeal and dollar suppression. The market will continue to assess the aftermath of the meeting and liquidity dynamics. Volatility is expected to remain at current levels, but attention should be paid to the potential disruptions to the correlation caused by marginal changes in data or news.
Frequently Asked Questions
What are the main drivers of the current strength of the US dollar index?
The recent rebound in the US dollar index is mainly due to better-than-expected US inflation data and an increased probability of a Federal Reserve rate hike. Producer price index and other data have increased market pricing in policy tightening. Technically, the price is trading between the middle and upper Bollinger Bands, with the MACD histogram showing a slight increase in bullish momentum, indicating that bulls are in control but the momentum has not yet been fully released. In the next 2-3 days, the 98.60-98.74 area will be a key resistance level, and the evolution of inflation expectations needs to be observed.
Can the current price of US crude oil remain above $100?
US crude oil is priced around 100.58, with the Bollinger Band middle line providing significant support. Geopolitical factors, especially developments related to the Strait of Hormuz, form the basis for price resilience. The MACD is in a balanced state, and the short-term direction depends on news confirmation. Upward resistance is at 103.69, while downward support is at 97.21. The consensus reached during the meeting regarding the opening of the Strait has had a stabilizing effect on market sentiment, but the actual passage situation still needs to be monitored.
What factors influence the price movement of gold?
Gold is currently trading close to the Bollinger Band middle line around 4700. The MACD histogram is showing signs of weakening but the momentum is waning, indicating a range-bound market. A stronger US dollar is providing significant resistance, while the yield environment is also impacting its safe-haven appeal. The short-term range is expected to be 4659-4741, with the middle line being a key level to watch. Wide-range fluctuations are anticipated over the next 2-3 days; close attention should be paid to the correlation between the US dollar and yields.
What impact will the pullback in US Treasury yields have on the overall market?
The 10-year yield was 4.444%, briefly breaking below the Bollinger Band middle line. The MACD turned from red to green, indicating a temporary weakening of bullish momentum. Downside support is seen in the 4.389-4.445 area. This pullback provides some breathing room for the US dollar and alleviates some financing pressure on assets, but inflation expectations still limit the downside potential of yields. From a cross-market perspective, the divergence between yields and the US dollar warrants continued attention.
What are the key points to observe regarding cross-market collaboration in the next 2-3 days?
Key focus areas include the interaction between the US dollar and yields, the persistence of the geopolitical premium in US oil, and changes in gold's sensitivity to the US dollar. On the funding front, dynamics in GC funding rates and SOFR pricing also provide supplementary signals. Overall, range-bound trading is highly probable, and any marginal changes in inflation data, geopolitical developments, or policy statements could trigger cascading adjustments. Investors should remain cautious and observe the effectiveness of key support and resistance levels in light of their own risk appetite.
- Risk Warning and Disclaimer
- The market involves risk, and trading may not be suitable for all investors. This article is for reference only and does not constitute personal investment advice, nor does it take into account certain users’ specific investment objectives, financial situation, or other needs. Any investment decisions made based on this information are at your own risk.