Silver Price Outlook: Rebound Unlikely to Reach $100
2026-05-14 20:45:30
Silver began a major upward trend at the end of 2025, reaching a high of $121.487 in January 2026 before quickly falling back and bottoming out at $60.964 in March. It then entered a period of consolidation and rebound. Currently, the price is around $86.68, and it is in the mid-term uptrend cycle that started from the $60 low, facing key resistance levels.
Macroeconomic fundamentals: Silver's resilience defies traditional logic
US April inflation and PPI data both exceeded market expectations, further solidifying the market consensus that the Federal Reserve will maintain its high-interest-rate policy for a longer period. According to traditional precious metal pricing logic, a strong dollar and high US Treasury yields should have continued to suppress silver's upward potential. However, silver has bucked the trend and resisted declines, indicating a fundamental shift in the underlying market logic, no longer relying on the recurring theme of Asian physical investment demand. Since most global silver is a byproduct of copper, lead, and zinc mines, the supply elasticity of minerals is inherently insufficient. Even with a significant rise in silver prices, mine capacity cannot be rapidly released in the short term, and the industry has maintained a widening supply-demand gap for several years. Coupled with the comprehensive upgrade of photovoltaic N-type battery technology, the steady increase in the market penetration of new energy vehicles, and the large-scale production of AI servers and computing hardware, structurally rigid industrial demand for silver has emerged. Short-term alternative materials are not yet mature enough to achieve large-scale silver-free substitution. Furthermore, the recurring geopolitical tensions in the Middle East and potential disruptions to the energy supply chain further push up global medium- to long-term inflation expectations, continuously supporting silver prices from a macroeconomic perspective.
COMEX physical inventory buildup and market liquidity crisis
Entering May, industry analysts unanimously consider the silver inventory squeeze as the most unique perspective on this market trend, and a new core variable that distinguishes it from traditional supply and demand analysis. COMEX silver registered inventories have been declining steadily from their historical peak of 531 million ounces in October 2025, currently shrinking to around 315 million ounces, a significant overall reduction. In the first two months of 2026, a total of 95 million ounces of silver flowed out of the US, exceeding the total annual export volume of the past few years, setting a new record for the speed of physical asset outflow. Although London's free-floating silver inventories have slightly recovered from the lows of last September, the overall inventory level remains in a historically low range, hovering around 235 million ounces. The well-known industry institution MetalsFocus has issued a warning, stating that the current silver spot inventory structure is extremely fragile, and the market still faces the risk of further inventory squeeze in the future. JPMorgan analyst Greg Shearer also made a clear assessment that if trade tariffs are reinstated, physical silver positions will shift again from the London International Physical Exchange to the New York Futures Exchange, directly causing a rapid tightening of global physical silver liquidity outside the United States, which could easily trigger extreme short-term price volatility in silver.
Industrial demand takes over, traditional Chinese demand narrative weakens.
The core driver of the silver market has now completely broken free from its reliance on Chinese retail investment and private physical silver purchases. Structural industrial demand has officially taken over as the primary support. Domestic photovoltaic companies stockpiled inventory before the adjustment of export tax rebate policies, coupled with industry battery technology upgrades leading to increased silver consumption per unit of photovoltaic product, which temporarily amplified industrial procurement. However, at the same time, domestic policies are addressing the overcapacity problem in the photovoltaic industry, gradually slowing the pace of industry expansion. Furthermore, high silver prices are forcing the industry chain to accelerate the development of silver-less and silver-free alternative technologies, which will gradually dilute the demand premium for silver in the long term. While overall domestic industrial output remains stable and resilient, it can no longer be the core narrative for a one-sided bull market in silver prices. The market pricing focus has shifted entirely to the balance between global inventory patterns, incremental industrial demand, and the US dollar interest rate.
The logic behind the gold-silver ratio compression is extremely divergent from institutional views.
The continued decline and compression of the gold-silver ratio is a key signal that silver has outperformed gold and led the precious metals sector in the short term. Bank of America analyst Michael Widmer maintains an extremely bullish outlook, relying on the historical valuation regression logic of the gold-silver ratio, and gives a very wide target range of $135 to $309 for silver prices in 2026. $135 corresponds to a gold-silver ratio falling back to the historical low of 32:1 in 2011, while $309 corresponds to the historical extreme ratio of 14:1 in 1980. In stark contrast, UBS's attitude is more conservative and cautious, maintaining its full-year target price at only around $80. This large discrepancy between UBS's conservative $80 estimate and Bank of America's extremely bullish $309 forecast represents a rare divergence in commodity analysis, fully reflecting a complete disconnect between the market's understanding of silver's industrial attributes premium, inventory squeeze effect, and safe-haven pricing logic. Even though the downward trend in the gold-silver ratio is clearly bullish for silver, the actual selling pressure from the heavy overhead supply far outweighs the upward momentum driven by fundamental factors, directly limiting the upside potential for silver in the long term.
Technical Analysis: Trading within the $85-$95 range
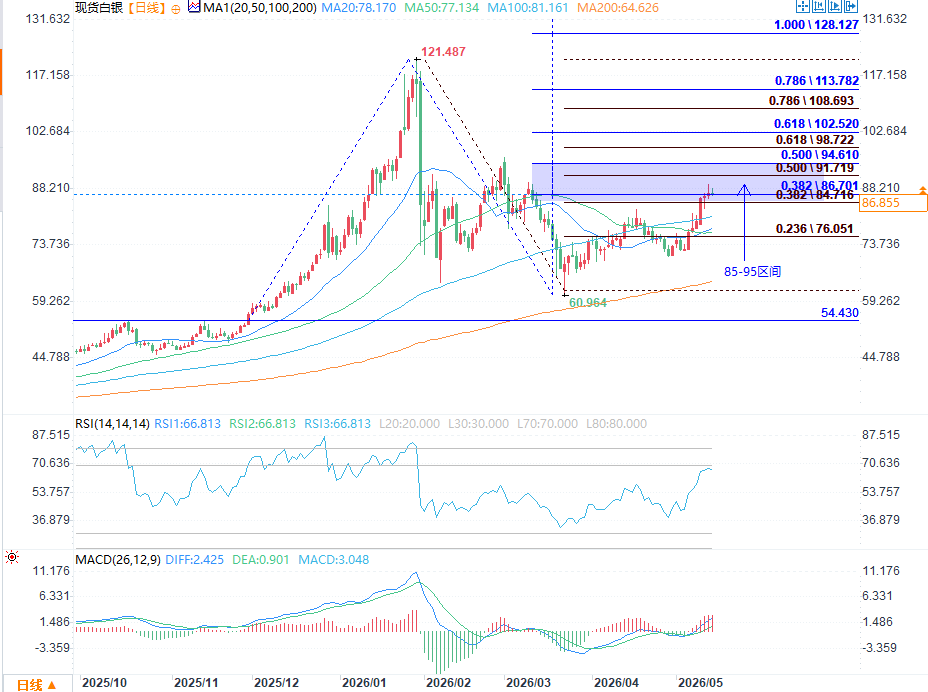
(Spot silver daily chart source: EasyTrade)
From the daily chart structure, the key contradiction in this round of silver price movement lies in the double resistance zone formed by two sets of Fibonacci retracement levels. The 50% retracement level of the surge from late 2025 to early 2026 falls around $95; while the 50% retracement level of the sharp drop from the beginning of the year to the March low is around $92. These two levels combined create a dense area of trapped capital in the $92-$95 range, which is a strong resistance that is difficult for short-term prices to break through. Currently, the price is in a trading range of $85-$95, with support at the 0.382 retracement level of $84.7, while the upper resistance is firmly suppressed by the double resistance. In the short term, the price is likely to maintain range-bound fluctuations, making a one-sided breakout unlikely.
From a technical perspective, the current rebound momentum is nearing its end. The RSI indicator is approaching the overbought level of 70, indicating that short-term bullish power has been significantly depleted, and the upward breakthrough momentum is insufficient. Although the MACD is still in a bullish state, the histogram has not continued to expand, showing that the upward momentum is weakening, forming a potential divergence signal with the price rebound. Although the moving average system is in a short-term bullish arrangement, the price is too close to the Fibonacci resistance above, and the support provided by the moving averages is insufficient to offset the selling pressure from trapped investors. Therefore, the current bullish momentum is more of a "rebound correction" than a trend reversal.
The current fundamental environment for silver is a complex interplay between bullish and bearish factors, particularly a hawkish one. On one hand, industrial demand and market expectations of interest rate cuts provide support; on the other hand, the Federal Reserve's long-term hawkish stance limits the downside potential of the dollar and real interest rates. As a commodity with both financial and commodity attributes, silver has experienced a significantly larger correction than gold, accumulating more overhead resistance. Under this macroeconomic backdrop, silver is unlikely to experience a unilateral rise driven solely by safe-haven demand, unlike gold. Instead, it is more likely to encounter resistance levels and pull back, continuing its range-bound trading pattern.
The key signals for breakouts and breakdowns will determine the future price movement of silver, which will depend on a successful breakout of the upper or lower limits of the trading range. If the price can break through and hold above $95 with significant volume, surpassing both Fibonacci resistance and trapped positions, a bullish trend will be initiated, with the first target being the 0.618 extension level around $102, and potentially even challenging the previous high of $120. Conversely, if the price falls below the $85 support and further breaks below the $76-$77 moving average and the 0.236 Fibonacci retracement level, the downtrend will resume, with key support at the 200-day moving average around $65, and potentially even testing the previous low of $61. Currently, trading within the range should focus on buying low and selling high, awaiting a clear breakout or breakdown signal to confirm a new trend direction.
Summarize
Technical pattern repair, continued inventory build-up on COMEX, robust global industrial demand, and geopolitical tensions fueling inflation risk aversion – these multiple positive factors have combined to support silver's current intermediate-term rebound. However, at the same time, three factors are creating strong upward constraints: the medium- to long-term downward pressure from the US dollar and US Treasury yields, the technological iteration of the photovoltaic industry's long-term de-silverization strategy, and massive selling pressure from trapped positions in the $100-$120 range.
From an operational perspective, if silver retraces to the $70-$80 range, it remains a reasonable buying opportunity. A rational target for this rebound could be $95-$100. However, given the continued pressure from densely packed trapped positions above and limited new capital inflows, this rally is likely to stall at the $100 level, lacking sufficient momentum to break through and return to the previous high of $120.
Macroeconomic fundamentals: Silver's resilience defies traditional logic
US April inflation and PPI data both exceeded market expectations, further solidifying the market consensus that the Federal Reserve will maintain its high-interest-rate policy for a longer period. According to traditional precious metal pricing logic, a strong dollar and high US Treasury yields should have continued to suppress silver's upward potential. However, silver has bucked the trend and resisted declines, indicating a fundamental shift in the underlying market logic, no longer relying on the recurring theme of Asian physical investment demand. Since most global silver is a byproduct of copper, lead, and zinc mines, the supply elasticity of minerals is inherently insufficient. Even with a significant rise in silver prices, mine capacity cannot be rapidly released in the short term, and the industry has maintained a widening supply-demand gap for several years. Coupled with the comprehensive upgrade of photovoltaic N-type battery technology, the steady increase in the market penetration of new energy vehicles, and the large-scale production of AI servers and computing hardware, structurally rigid industrial demand for silver has emerged. Short-term alternative materials are not yet mature enough to achieve large-scale silver-free substitution. Furthermore, the recurring geopolitical tensions in the Middle East and potential disruptions to the energy supply chain further push up global medium- to long-term inflation expectations, continuously supporting silver prices from a macroeconomic perspective.
COMEX physical inventory buildup and market liquidity crisis
Entering May, industry analysts unanimously consider the silver inventory squeeze as the most unique perspective on this market trend, and a new core variable that distinguishes it from traditional supply and demand analysis. COMEX silver registered inventories have been declining steadily from their historical peak of 531 million ounces in October 2025, currently shrinking to around 315 million ounces, a significant overall reduction. In the first two months of 2026, a total of 95 million ounces of silver flowed out of the US, exceeding the total annual export volume of the past few years, setting a new record for the speed of physical asset outflow. Although London's free-floating silver inventories have slightly recovered from the lows of last September, the overall inventory level remains in a historically low range, hovering around 235 million ounces. The well-known industry institution MetalsFocus has issued a warning, stating that the current silver spot inventory structure is extremely fragile, and the market still faces the risk of further inventory squeeze in the future. JPMorgan analyst Greg Shearer also made a clear assessment that if trade tariffs are reinstated, physical silver positions will shift again from the London International Physical Exchange to the New York Futures Exchange, directly causing a rapid tightening of global physical silver liquidity outside the United States, which could easily trigger extreme short-term price volatility in silver.
Industrial demand takes over, traditional Chinese demand narrative weakens.
The core driver of the silver market has now completely broken free from its reliance on Chinese retail investment and private physical silver purchases. Structural industrial demand has officially taken over as the primary support. Domestic photovoltaic companies stockpiled inventory before the adjustment of export tax rebate policies, coupled with industry battery technology upgrades leading to increased silver consumption per unit of photovoltaic product, which temporarily amplified industrial procurement. However, at the same time, domestic policies are addressing the overcapacity problem in the photovoltaic industry, gradually slowing the pace of industry expansion. Furthermore, high silver prices are forcing the industry chain to accelerate the development of silver-less and silver-free alternative technologies, which will gradually dilute the demand premium for silver in the long term. While overall domestic industrial output remains stable and resilient, it can no longer be the core narrative for a one-sided bull market in silver prices. The market pricing focus has shifted entirely to the balance between global inventory patterns, incremental industrial demand, and the US dollar interest rate.
The logic behind the gold-silver ratio compression is extremely divergent from institutional views.
The continued decline and compression of the gold-silver ratio is a key signal that silver has outperformed gold and led the precious metals sector in the short term. Bank of America analyst Michael Widmer maintains an extremely bullish outlook, relying on the historical valuation regression logic of the gold-silver ratio, and gives a very wide target range of $135 to $309 for silver prices in 2026. $135 corresponds to a gold-silver ratio falling back to the historical low of 32:1 in 2011, while $309 corresponds to the historical extreme ratio of 14:1 in 1980. In stark contrast, UBS's attitude is more conservative and cautious, maintaining its full-year target price at only around $80. This large discrepancy between UBS's conservative $80 estimate and Bank of America's extremely bullish $309 forecast represents a rare divergence in commodity analysis, fully reflecting a complete disconnect between the market's understanding of silver's industrial attributes premium, inventory squeeze effect, and safe-haven pricing logic. Even though the downward trend in the gold-silver ratio is clearly bullish for silver, the actual selling pressure from the heavy overhead supply far outweighs the upward momentum driven by fundamental factors, directly limiting the upside potential for silver in the long term.
Technical Analysis: Trading within the $85-$95 range
(Spot silver daily chart source: EasyTrade)
From the daily chart structure, the key contradiction in this round of silver price movement lies in the double resistance zone formed by two sets of Fibonacci retracement levels. The 50% retracement level of the surge from late 2025 to early 2026 falls around $95; while the 50% retracement level of the sharp drop from the beginning of the year to the March low is around $92. These two levels combined create a dense area of trapped capital in the $92-$95 range, which is a strong resistance that is difficult for short-term prices to break through. Currently, the price is in a trading range of $85-$95, with support at the 0.382 retracement level of $84.7, while the upper resistance is firmly suppressed by the double resistance. In the short term, the price is likely to maintain range-bound fluctuations, making a one-sided breakout unlikely.
From a technical perspective, the current rebound momentum is nearing its end. The RSI indicator is approaching the overbought level of 70, indicating that short-term bullish power has been significantly depleted, and the upward breakthrough momentum is insufficient. Although the MACD is still in a bullish state, the histogram has not continued to expand, showing that the upward momentum is weakening, forming a potential divergence signal with the price rebound. Although the moving average system is in a short-term bullish arrangement, the price is too close to the Fibonacci resistance above, and the support provided by the moving averages is insufficient to offset the selling pressure from trapped investors. Therefore, the current bullish momentum is more of a "rebound correction" than a trend reversal.
The current fundamental environment for silver is a complex interplay between bullish and bearish factors, particularly a hawkish one. On one hand, industrial demand and market expectations of interest rate cuts provide support; on the other hand, the Federal Reserve's long-term hawkish stance limits the downside potential of the dollar and real interest rates. As a commodity with both financial and commodity attributes, silver has experienced a significantly larger correction than gold, accumulating more overhead resistance. Under this macroeconomic backdrop, silver is unlikely to experience a unilateral rise driven solely by safe-haven demand, unlike gold. Instead, it is more likely to encounter resistance levels and pull back, continuing its range-bound trading pattern.
The key signals for breakouts and breakdowns will determine the future price movement of silver, which will depend on a successful breakout of the upper or lower limits of the trading range. If the price can break through and hold above $95 with significant volume, surpassing both Fibonacci resistance and trapped positions, a bullish trend will be initiated, with the first target being the 0.618 extension level around $102, and potentially even challenging the previous high of $120. Conversely, if the price falls below the $85 support and further breaks below the $76-$77 moving average and the 0.236 Fibonacci retracement level, the downtrend will resume, with key support at the 200-day moving average around $65, and potentially even testing the previous low of $61. Currently, trading within the range should focus on buying low and selling high, awaiting a clear breakout or breakdown signal to confirm a new trend direction.
Summarize
Technical pattern repair, continued inventory build-up on COMEX, robust global industrial demand, and geopolitical tensions fueling inflation risk aversion – these multiple positive factors have combined to support silver's current intermediate-term rebound. However, at the same time, three factors are creating strong upward constraints: the medium- to long-term downward pressure from the US dollar and US Treasury yields, the technological iteration of the photovoltaic industry's long-term de-silverization strategy, and massive selling pressure from trapped positions in the $100-$120 range.
From an operational perspective, if silver retraces to the $70-$80 range, it remains a reasonable buying opportunity. A rational target for this rebound could be $95-$100. However, given the continued pressure from densely packed trapped positions above and limited new capital inflows, this rally is likely to stall at the $100 level, lacking sufficient momentum to break through and return to the previous high of $120.
- Risk Warning and Disclaimer
- The market involves risk, and trading may not be suitable for all investors. This article is for reference only and does not constitute personal investment advice, nor does it take into account certain users’ specific investment objectives, financial situation, or other needs. Any investment decisions made based on this information are at your own risk.