The US dollar has held firm above the 99 mark, but Warsh's balance sheet reduction plan has run into a US debt bomb. Can this rebound reach 100.64?
2026-05-15 20:21:30
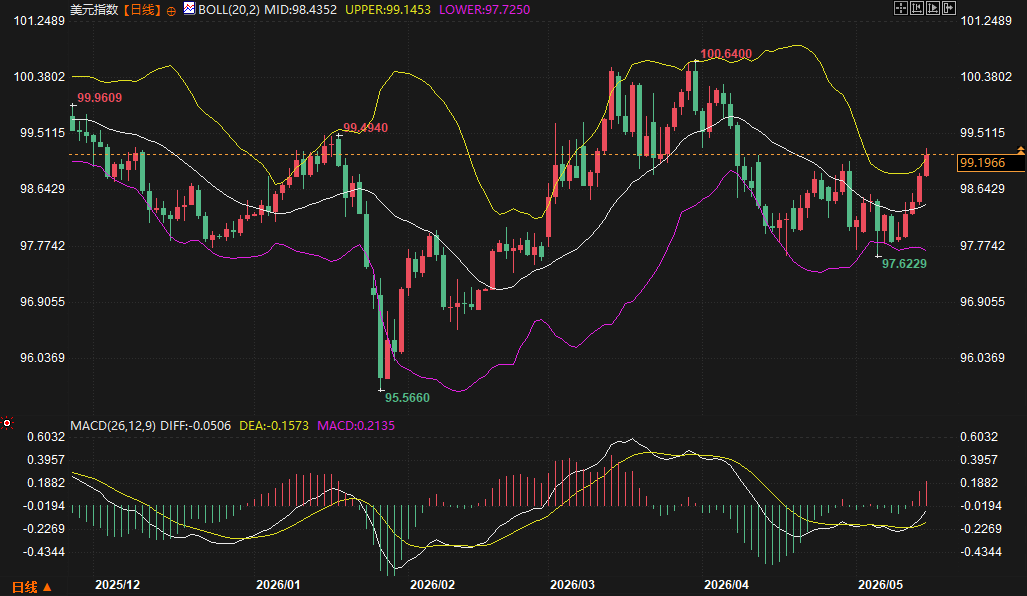
On Friday (May 15), the US dollar index was last quoted at 99.1966, maintaining its strong performance after breaking through the upper Bollinger Band during the session. This week, the dollar index has rebounded continuously from its April low of 97.6229, recovering some of its previous losses and approaching the lower edge of the consolidation range from March to April. Technically, short-term bullish momentum is being released, with the MACD forming a golden cross and the red bars expanding, while the Bollinger Bands are flattening and trending upwards. Reports from major overseas institutions indicate that under the new Federal Reserve Chairman Kevin Warsh, his plan to reduce the Fed's balance sheet faces constraints such as rising US federal debt. The market is focused on the impact of policy framework adjustments on interest rates and the dollar. Overall, both fundamental and technical factors point to a cautiously optimistic short-term outlook, but upward pressure and debt dynamics still need to be observed.
The US dollar index has currently risen above the upper Bollinger Band (20,2) at 99.1453, indicating short-term strength. The Bollinger Bands are generally trending upwards after a period of flattening, with the middle band at 98.4352 and the lower band at 97.7250. Data shows that since the low of 97.6229 in April 2026, a rebound has gradually begun, recovering the losses from early April and currently approaching the lower edge of the previous consolidation range.
In the MACD (26,12,9) indicator, the DIFF line has crossed above the DEA line, forming a golden cross, and the MACD histogram continues to expand, indicating that short-term bullish momentum is in the release phase. Compared to the high MACD level corresponding to the March 2026 high, the current level is still in a low-level recovery range and has not yet entered a clearly overbought state. This suggests that the rebound has a certain degree of sustainability, but a pullback to confirm the breakout above the upper trendline should be anticipated.
Key technical range : The immediate resistance level is the April 2026 high of 100.6400; the first support level is the Bollinger Band middle line at 98.4352. If this level is breached, the second support level to watch is the previous low of 97.6229. The logic suggests that when the price is trading above the upper Bollinger Band, it's necessary to consider trading volume and indicator divergence to determine if it's a valid breakout.
On May 15, major overseas institutions reported that newly confirmed Federal Reserve Chairman Kevin Warsh advocates reducing the central bank's "footprint" in financial markets and returning to a more conventional monetary policy framework to better focus on inflation control and reduce market distortions. The report points out that while this plan is theoretically attractive, its practical implementation may be affected by rising US federal debt and changes in the attractiveness of Treasury bonds.
The report cites analysis suggesting that shrinking the balance sheet could push up long-term interest rates, putting pressure on borrowing costs for businesses and households, and potentially prompting the Federal Reserve to intervene to stabilize borrowing costs if necessary. The Fed's current assets are approximately $6.7 trillion, down from their 2022 peak, but have recently grown slowly to maintain ample bank reserves. Warsh has long criticized the lack of a clear framework for asset purchases during crises, emphasizing the need for clear rules for buying and exit strategies.
Data shows that the Congressional Budget Office (CBO) projects the federal deficit to reach 5.8% of GDP in fiscal year 2026, higher than the 50-year average of 3.8%, with rising interest costs being the main driver. This creates potential tension with the balance sheet reduction target and may require closer coordination with the Treasury Department. Logically, the policy framework discussion process could last 9-12 months, during which market expectations regarding the interest rate path will influence the dollar's performance.
The report further points out that the "convenience yield" on U.S. Treasury bonds has declined. Research from the St. Louis Federal Reserve shows that this yield has fallen by about 40 basis points since the balance sheet reduction process began in 2022, meaning the U.S. needs to pay a higher premium to investors to attract lending. This poses an additional challenge to Warsh's balance sheet reduction plan and could be seen as a "task spread" of fiscal affairs.
Many analysts believe that large central bank asset holdings remain necessary to provide liquidity to banks, and excessive reduction could lead to inefficient competition for reserves within the financial system. Surveys show that most respondents do not believe the current size of the Federal Reserve's balance sheet poses a problem for US economic growth or financial stability.
A combined analysis of fundamental and technical factors suggests that debt dynamics may push up long-term yields, providing some short-term resilience for the US dollar. However, if this triggers market concerns about policy uncertainty, it could test the technical support level. Data shows that during the dollar index rebound, it's crucial to continuously monitor the Federal Reserve's policy statements and economic data releases to determine whether the bullish momentum can effectively break through the 100.6400 resistance level.
In summary, technical breakout signals provide support for short-term price movements, while fundamentals focus on the transition of the Federal Reserve leadership and debt constraints. Warsh's policy philosophy emphasizes discipline and clarity of framework, which resonates somewhat with the current MACD signal rebounding from its lows, indicating that the market is gradually pricing in expectations of policy changes.
However, the common pullback after a breakout from the upper Bollinger Band serves as a reminder that strong signals still require fundamental confirmation. If next week's Fed communications or economic data (such as inflation and forward employment indicators) show strong policy continuity, it could solidify the upper edge of the current range; conversely, if debt pressures trigger broader discussion, it could lead prices to seek support near the middle Bollinger Band at 98.4352. The overall logic is consistent: strong technicals provide a buffer for fundamental adjustments, while fundamental constraints limit the rebound's height.
In the short term (around the next week), the US dollar index is likely to fluctuate with a slight upward bias within the 99.00-100.00 range, with support provided by the upper Bollinger Band. However, it may face profit-taking near the resistance level of 100.6400. The logic suggests that without significant negative fundamental shocks, the rebound momentum is likely to continue; conversely, the possibility of a pullback to the middle Bollinger Band increases.
In the medium to long term, discussions on the Federal Reserve's balance sheet framework and debt dynamics will continue to influence interest rate expectations. If the balance sheet reduction process proceeds smoothly without triggering sharp market fluctuations, the US dollar may receive some support; however, if upward pressure on long-term interest rates exceeds expectations, it may limit the upside. Overall, the trend will depend on increased policy transparency and economic data verification, and it is expected to gradually find its direction within the current rebound structure, maintaining a range-bound mindset.
What is the significance of the US dollar index breaking through the upper Bollinger Band?
The current price has risen above the upper Bollinger Band at 99.1453, a short-term bullish signal. The Bollinger Bands are flattening and widening upwards, further confirming the release of bullish momentum. Combined with the MACD golden cross and expanding red bars, this indicates that the rebound since the April lows has technical continuity. However, attention should be paid to the possibility of a pullback after the breakout, which is a common price action and does not necessarily change the overall rebound structure.
What are the main constraints facing the balance sheet reduction plan of new Federal Reserve Chairman Warsh?
Reports from major overseas institutions indicate that the main constraints stem from rising US federal debt and changing attractiveness of Treasury bonds. Expanding deficits are pushing up interest costs, potentially leading to upward pressure on long-term interest rates alongside quantitative easing. Simultaneously, the lack of a clear framework for quantitative easing and an exit strategy increases the complexity of policy implementation. Analysts believe this requires coordination with the Treasury Department and may involve a lengthy discussion period.
How will the support and resistance levels below affect the prediction of next week's trend?
The first support level is the Bollinger Band middle line at 98.4352, providing strong technical cushioning; the second support level is the previous low of 97.6229. The resistance level is 100.6400 (April high). Logically, with the price currently trading within this range, next week's price action will likely revolve around these key levels. Holding above the middle line would indicate a bullish bias, while testing the upper line and encountering resistance could lead to a period of consolidation.
How do debt dynamics correlate with the US dollar index?
The report points out that the decline in Treasury bond yields implies higher borrowing costs, which may support the dollar's short-term resilience but also increase the difficulty of balance sheet reduction. Research from the St. Louis Fed shows that related yields have fallen by about 40 basis points. If debt pressures persist, they may indirectly affect the dollar's performance through the interest rate path; it remains to be seen whether policy communication can effectively manage market expectations.
When combining technical and fundamental analysis, what factors should be emphasized?
Key focus areas include whether the MACD indicator maintains its golden cross, the continuation of the Bollinger Bands trend, and the Fed's policy statements and economic data releases. Fundamentals provide directional guidance, while technical analysis defines the specific range. Data shows that combining both approaches enhances the robustness of trend judgments and avoids biases from a single perspective. Next week, the combined influence of policy and data is expected to lead to a clearer range-bound trading pattern.
Technical Breakout Characteristics and Key Ranges
The US dollar index has currently risen above the upper Bollinger Band (20,2) at 99.1453, indicating short-term strength. The Bollinger Bands are generally trending upwards after a period of flattening, with the middle band at 98.4352 and the lower band at 97.7250. Data shows that since the low of 97.6229 in April 2026, a rebound has gradually begun, recovering the losses from early April and currently approaching the lower edge of the previous consolidation range.
In the MACD (26,12,9) indicator, the DIFF line has crossed above the DEA line, forming a golden cross, and the MACD histogram continues to expand, indicating that short-term bullish momentum is in the release phase. Compared to the high MACD level corresponding to the March 2026 high, the current level is still in a low-level recovery range and has not yet entered a clearly overbought state. This suggests that the rebound has a certain degree of sustainability, but a pullback to confirm the breakout above the upper trendline should be anticipated.
Key technical range : The immediate resistance level is the April 2026 high of 100.6400; the first support level is the Bollinger Band middle line at 98.4352. If this level is breached, the second support level to watch is the previous low of 97.6229. The logic suggests that when the price is trading above the upper Bollinger Band, it's necessary to consider trading volume and indicator divergence to determine if it's a valid breakout.
Federal Reserve Policy Transition and Balance Sheet Discussion
On May 15, major overseas institutions reported that newly confirmed Federal Reserve Chairman Kevin Warsh advocates reducing the central bank's "footprint" in financial markets and returning to a more conventional monetary policy framework to better focus on inflation control and reduce market distortions. The report points out that while this plan is theoretically attractive, its practical implementation may be affected by rising US federal debt and changes in the attractiveness of Treasury bonds.
The report cites analysis suggesting that shrinking the balance sheet could push up long-term interest rates, putting pressure on borrowing costs for businesses and households, and potentially prompting the Federal Reserve to intervene to stabilize borrowing costs if necessary. The Fed's current assets are approximately $6.7 trillion, down from their 2022 peak, but have recently grown slowly to maintain ample bank reserves. Warsh has long criticized the lack of a clear framework for asset purchases during crises, emphasizing the need for clear rules for buying and exit strategies.
Data shows that the Congressional Budget Office (CBO) projects the federal deficit to reach 5.8% of GDP in fiscal year 2026, higher than the 50-year average of 3.8%, with rising interest costs being the main driver. This creates potential tension with the balance sheet reduction target and may require closer coordination with the Treasury Department. Logically, the policy framework discussion process could last 9-12 months, during which market expectations regarding the interest rate path will influence the dollar's performance.
The impact of debt dynamics on long-term interest rates and the US dollar
The report further points out that the "convenience yield" on U.S. Treasury bonds has declined. Research from the St. Louis Federal Reserve shows that this yield has fallen by about 40 basis points since the balance sheet reduction process began in 2022, meaning the U.S. needs to pay a higher premium to investors to attract lending. This poses an additional challenge to Warsh's balance sheet reduction plan and could be seen as a "task spread" of fiscal affairs.
Many analysts believe that large central bank asset holdings remain necessary to provide liquidity to banks, and excessive reduction could lead to inefficient competition for reserves within the financial system. Surveys show that most respondents do not believe the current size of the Federal Reserve's balance sheet poses a problem for US economic growth or financial stability.
A combined analysis of fundamental and technical factors suggests that debt dynamics may push up long-term yields, providing some short-term resilience for the US dollar. However, if this triggers market concerns about policy uncertainty, it could test the technical support level. Data shows that during the dollar index rebound, it's crucial to continuously monitor the Federal Reserve's policy statements and economic data releases to determine whether the bullish momentum can effectively break through the 100.6400 resistance level.
Interactive verification of fundamental and technical aspects
In summary, technical breakout signals provide support for short-term price movements, while fundamentals focus on the transition of the Federal Reserve leadership and debt constraints. Warsh's policy philosophy emphasizes discipline and clarity of framework, which resonates somewhat with the current MACD signal rebounding from its lows, indicating that the market is gradually pricing in expectations of policy changes.
However, the common pullback after a breakout from the upper Bollinger Band serves as a reminder that strong signals still require fundamental confirmation. If next week's Fed communications or economic data (such as inflation and forward employment indicators) show strong policy continuity, it could solidify the upper edge of the current range; conversely, if debt pressures trigger broader discussion, it could lead prices to seek support near the middle Bollinger Band at 98.4352. The overall logic is consistent: strong technicals provide a buffer for fundamental adjustments, while fundamental constraints limit the rebound's height.
Trend Outlook
In the short term (around the next week), the US dollar index is likely to fluctuate with a slight upward bias within the 99.00-100.00 range, with support provided by the upper Bollinger Band. However, it may face profit-taking near the resistance level of 100.6400. The logic suggests that without significant negative fundamental shocks, the rebound momentum is likely to continue; conversely, the possibility of a pullback to the middle Bollinger Band increases.
In the medium to long term, discussions on the Federal Reserve's balance sheet framework and debt dynamics will continue to influence interest rate expectations. If the balance sheet reduction process proceeds smoothly without triggering sharp market fluctuations, the US dollar may receive some support; however, if upward pressure on long-term interest rates exceeds expectations, it may limit the upside. Overall, the trend will depend on increased policy transparency and economic data verification, and it is expected to gradually find its direction within the current rebound structure, maintaining a range-bound mindset.
Frequently Asked Questions
What is the significance of the US dollar index breaking through the upper Bollinger Band?
The current price has risen above the upper Bollinger Band at 99.1453, a short-term bullish signal. The Bollinger Bands are flattening and widening upwards, further confirming the release of bullish momentum. Combined with the MACD golden cross and expanding red bars, this indicates that the rebound since the April lows has technical continuity. However, attention should be paid to the possibility of a pullback after the breakout, which is a common price action and does not necessarily change the overall rebound structure.
What are the main constraints facing the balance sheet reduction plan of new Federal Reserve Chairman Warsh?
Reports from major overseas institutions indicate that the main constraints stem from rising US federal debt and changing attractiveness of Treasury bonds. Expanding deficits are pushing up interest costs, potentially leading to upward pressure on long-term interest rates alongside quantitative easing. Simultaneously, the lack of a clear framework for quantitative easing and an exit strategy increases the complexity of policy implementation. Analysts believe this requires coordination with the Treasury Department and may involve a lengthy discussion period.
How will the support and resistance levels below affect the prediction of next week's trend?
The first support level is the Bollinger Band middle line at 98.4352, providing strong technical cushioning; the second support level is the previous low of 97.6229. The resistance level is 100.6400 (April high). Logically, with the price currently trading within this range, next week's price action will likely revolve around these key levels. Holding above the middle line would indicate a bullish bias, while testing the upper line and encountering resistance could lead to a period of consolidation.
How do debt dynamics correlate with the US dollar index?
The report points out that the decline in Treasury bond yields implies higher borrowing costs, which may support the dollar's short-term resilience but also increase the difficulty of balance sheet reduction. Research from the St. Louis Fed shows that related yields have fallen by about 40 basis points. If debt pressures persist, they may indirectly affect the dollar's performance through the interest rate path; it remains to be seen whether policy communication can effectively manage market expectations.
When combining technical and fundamental analysis, what factors should be emphasized?
Key focus areas include whether the MACD indicator maintains its golden cross, the continuation of the Bollinger Bands trend, and the Fed's policy statements and economic data releases. Fundamentals provide directional guidance, while technical analysis defines the specific range. Data shows that combining both approaches enhances the robustness of trend judgments and avoids biases from a single perspective. Next week, the combined influence of policy and data is expected to lead to a clearer range-bound trading pattern.
- Risk Warning and Disclaimer
- The market involves risk, and trading may not be suitable for all investors. This article is for reference only and does not constitute personal investment advice, nor does it take into account certain users’ specific investment objectives, financial situation, or other needs. Any investment decisions made based on this information are at your own risk.