Market Watchlist for the Next 72 Hours: Three Key Levels to Determine Bullish or Bearish Direction
2026-05-21 21:09:29
On Thursday (May 21), oil prices rose significantly due to renewed tensions in Iran, while US stock futures retreated slightly, and market risk appetite cooled somewhat. The yield on the 10-year US Treasury note rose to 4.607%, continuing its recent upward trend. The US dollar index remained high around 99.3. Gold prices came under pressure, with spot gold falling to around $4,513 per ounce. Today's market focus is on the impact of geopolitical factors on inflation expectations, as well as the digestion of subsequent economic data and Fed policy signals. Overall, risk aversion and interest rate expectations have jointly shaped the short-term cross-market linkage pattern.

Iran's Supreme Leader's order to ban the export of near-weapon-grade uranium dampened market optimism regarding peace talks, directly causing a rapid rebound in oil prices. Brent crude futures jumped nearly 3% to around $107.4 per barrel. High oil prices, passed on through energy costs, exacerbated market concerns about the sustainability of inflation. Data showed that the yield on the 10-year US Treasury note rose again to 4.607% on Wednesday after ending a three-day winning streak, reflecting investors' demand for higher compensation to cope with potential price pressures.
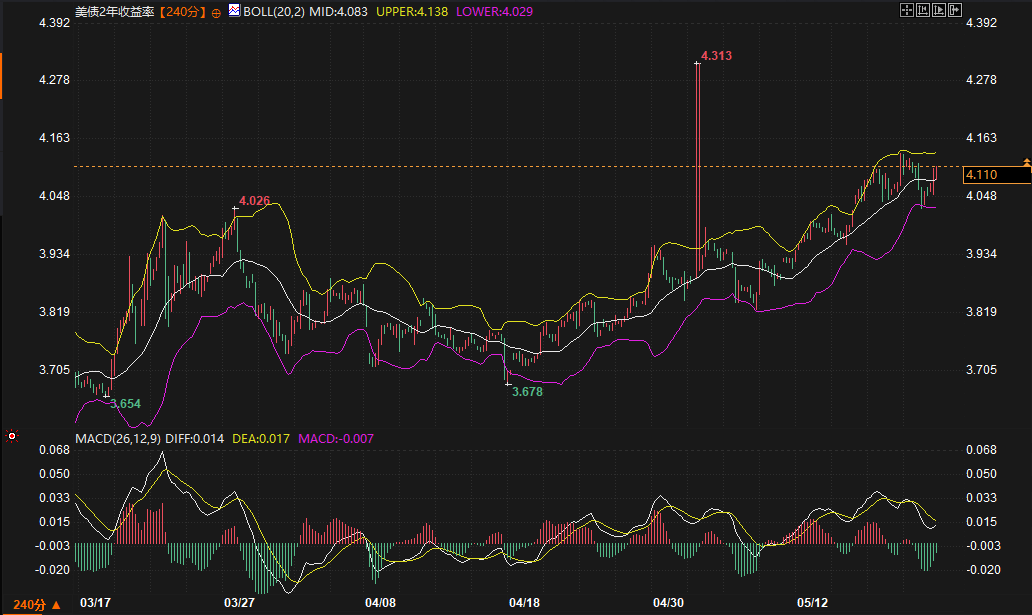
From a technical perspective, the 2-year US Treasury yield is currently at 4.110%, below the upper Bollinger Band at 4.138%, approaching a resistance zone. The candlestick chart shows an upward trend since the end of April, reaching a new high for the period. However, the MACD indicator shows the DIFF line below the DEA line, with the MACD value slightly negative, indicating a slight weakening of short-term bullish momentum. Logically, if oil prices remain high, yields are likely to fluctuate within the 4.56%-4.63% range, with a tactical bias favoring resistance at higher levels.
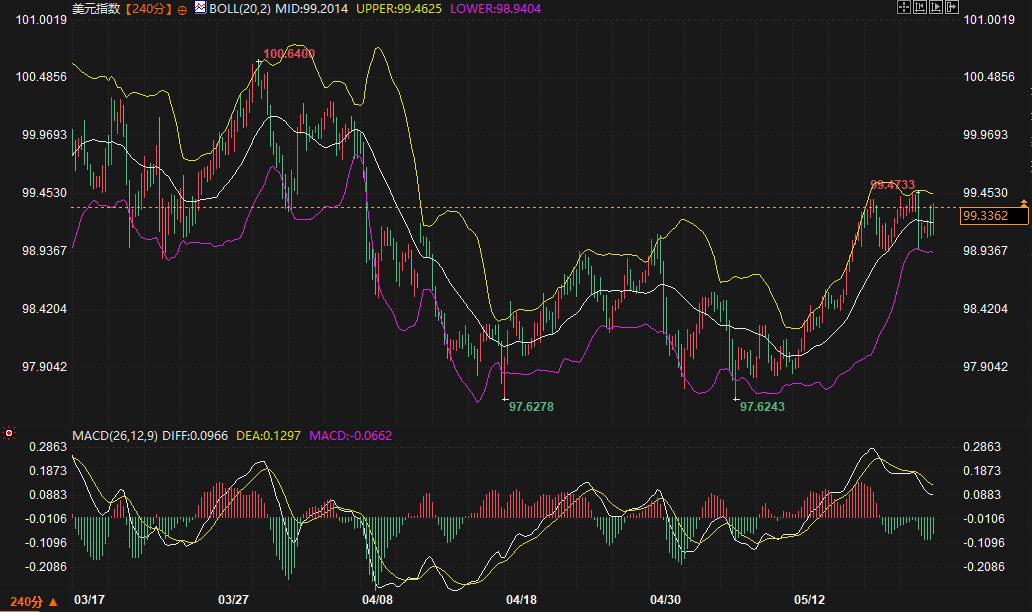
The US dollar index is currently at 99.3362, close to its recent high of 99.4733, having entered a period of fluctuating upward movement after bottoming out in mid-to-late April. Amid geopolitical uncertainties, the US dollar has been supported as a major safe-haven asset, while the high-yield environment further enhances its attractiveness. Analysts from major overseas institutions point out that the lack of substantial progress in the Middle East situation has fueled inflation concerns, pushing up the relative strength of the US dollar against other currencies.
Technical signals indicate that the US dollar index is below the upper Bollinger Band at 99.4625, showing a clear short-term upward trend. However, the MACD indicator shows the DIFF line below the DEA line and the MACD slightly negative, suggesting a potential for consolidation or a pullback near this recent high. Data shows that short-term support for the US dollar index is around the middle Bollinger Band at 99.20, while resistance is at 99.46. If geopolitical risks do not ease significantly, the US dollar is likely to maintain a slightly bullish, volatile pattern.
The latest FOMC meeting minutes show that most participants believe that if inflation persists above 2%, "some policy tightening" may become appropriate, with several officials leaning towards removing the dovish bias from the statement. This stance resonates with the current rebound in oil prices, further reinforcing the market's hawkish interpretation of the interest rate path. While weaker-than-expected Eurozone and UK PMI data provided some buffer, domestic inflationary pressures in the US dominated bond market movements.
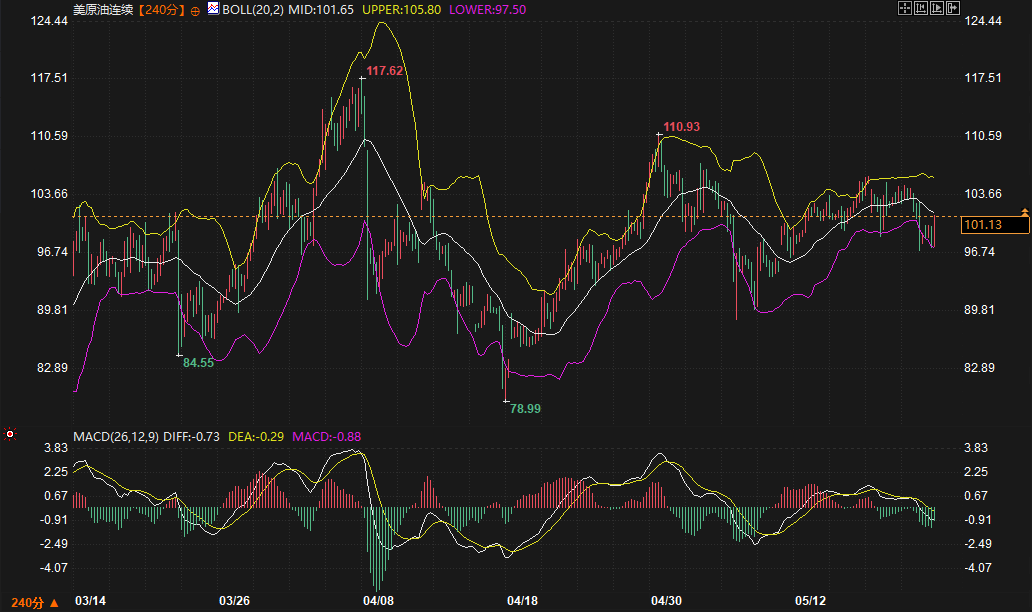
The current crude oil futures contract is trading at $101.13 per barrel, fluctuating between $100 and $105, near the middle Bollinger Band. The MACD shows bearish momentum, indicating a potential test of the lower Bollinger Band support in the short term. Oil price movements will continue to be a key variable linking US Treasury yields and the US dollar; any escalating expectations of supply disruptions could amplify upward pressure on yields.
Today will see the release of several data points, including initial jobless claims, the Philadelphia Fed Manufacturing Index, and leading indicators. The market expects limited change in initial jobless claims, indicating a resilient labor market; manufacturing and services PMIs are anticipated to see slight adjustments. Combined with the progress of corporate earnings season, investors are assessing the trade-off between economic resilience and inflation risks.
Combining fundamental and technical factors, support/resistance zones are key to determining short-term trends. The 10-year yield is expected to trade within the 4.56%-4.63% range, while the US dollar index is expected to trade within the 99.20-99.46 range. The evolution of geopolitical variables will determine whether these ranges are effectively broken.
Over the next 2-3 days, the US dollar index and US Treasury yields are expected to maintain a high-level, slightly bullish trend. If the situation in Iran continues to lack signs of easing, inflation expectations supported by oil prices will limit the downside for yields, while safe-haven buying of the dollar will also provide a floor. However, technical indicators suggest that bullish momentum has weakened, and a period of consolidation is needed. If subsequent economic data does not significantly improve the resilience of the labor market or exacerbate inflation concerns, the market may seek equilibrium within the current range. The overall logic is consistent with the combination of geopolitically driven caution and expectations of policy tightening; short-term trends still need close monitoring of oil prices and data for verification.
How exactly does the tense situation in Iran affect US Treasury yields?
Iran's latest statements have exacerbated market concerns about a potential disruption in the Strait of Hormuz, pushing up oil prices and impacting inflation expectations. Coupled with discussions of policy tightening in the FOMC minutes, investors are demanding higher yields as compensation, causing the 10-year yield to rise to 4.607%. This correlation reflects the amplifying effect of energy prices in the current environment; if oil prices remain high in the short term, yields are likely to experience upward pressure and fluctuations.
What do the current technical signals for the US dollar index mean?
The US dollar index is approaching the upper Bollinger Band. While the price action remains volatile and upward, the MACD indicates a slight weakening of bullish momentum, suggesting resistance around 99.46. Support lies at the middle Bollinger Band around 99.20. Considering its geopolitical safe-haven characteristics, a sharp decline in the dollar is unlikely in the short term, but high-level consolidation is probable. The impact of oil prices and data on risk appetite needs to be closely monitored.
How much has the rise in oil prices changed expectations regarding Federal Reserve policy?
The rebound in oil prices has reinforced concerns about persistent inflation, echoing the majority of officials' statements in the minutes regarding "policy tightening." Market expectations for a hawkish shift in the interest rate path have increased, but the Federal Reserve continues to emphasize its data-dependent approach. Over the next two to three days, oil price movements will be a crucial window for observing changes in policy expectations; if energy prices stabilize and decline, tightening pressures may ease temporarily.
Does the logic of a negative correlation between gold and the US dollar, as well as US Treasury yields, still hold true?
This holds true under the current circumstances. A stronger dollar and rising yields have increased the opportunity cost of holding non-yielding assets, causing spot gold to fall below the middle Bollinger Band. Although gold has inflation-hedging properties, it still faces downward pressure in the short term due to the combined effects of high interest rates and a strong dollar. The strength of any rebound will depend on the pace of geopolitical risk development.
What variables should we pay close attention to in the next 2-3 days to determine the trend?
Key variables include oil price movements, the actual performance of today's economic data (such as initial jobless claims and PMI), and any new developments in geopolitical negotiations. Technically, holding or breaking through the 4.56%-4.63% yield range and the 99.20-99.46 USD range will provide guidance for future direction. Overall, a cautious approach is advised, avoiding over-interpreting cross-market correlations based on a single factor.
Geopolitical factors have fueled inflation expectations, causing US Treasury yields to continue rising.
Iran's Supreme Leader's order to ban the export of near-weapon-grade uranium dampened market optimism regarding peace talks, directly causing a rapid rebound in oil prices. Brent crude futures jumped nearly 3% to around $107.4 per barrel. High oil prices, passed on through energy costs, exacerbated market concerns about the sustainability of inflation. Data showed that the yield on the 10-year US Treasury note rose again to 4.607% on Wednesday after ending a three-day winning streak, reflecting investors' demand for higher compensation to cope with potential price pressures.
From a technical perspective, the 2-year US Treasury yield is currently at 4.110%, below the upper Bollinger Band at 4.138%, approaching a resistance zone. The candlestick chart shows an upward trend since the end of April, reaching a new high for the period. However, the MACD indicator shows the DIFF line below the DEA line, with the MACD value slightly negative, indicating a slight weakening of short-term bullish momentum. Logically, if oil prices remain high, yields are likely to fluctuate within the 4.56%-4.63% range, with a tactical bias favoring resistance at higher levels.
The US dollar index is fluctuating at high levels, highlighting its safe-haven appeal in the currency market.
The US dollar index is currently at 99.3362, close to its recent high of 99.4733, having entered a period of fluctuating upward movement after bottoming out in mid-to-late April. Amid geopolitical uncertainties, the US dollar has been supported as a major safe-haven asset, while the high-yield environment further enhances its attractiveness. Analysts from major overseas institutions point out that the lack of substantial progress in the Middle East situation has fueled inflation concerns, pushing up the relative strength of the US dollar against other currencies.
Technical signals indicate that the US dollar index is below the upper Bollinger Band at 99.4625, showing a clear short-term upward trend. However, the MACD indicator shows the DIFF line below the DEA line and the MACD slightly negative, suggesting a potential for consolidation or a pullback near this recent high. Data shows that short-term support for the US dollar index is around the middle Bollinger Band at 99.20, while resistance is at 99.46. If geopolitical risks do not ease significantly, the US dollar is likely to maintain a slightly bullish, volatile pattern.
Oil prices and the release of the Federal Reserve minutes have fueled expectations of policy tightening.
The latest FOMC meeting minutes show that most participants believe that if inflation persists above 2%, "some policy tightening" may become appropriate, with several officials leaning towards removing the dovish bias from the statement. This stance resonates with the current rebound in oil prices, further reinforcing the market's hawkish interpretation of the interest rate path. While weaker-than-expected Eurozone and UK PMI data provided some buffer, domestic inflationary pressures in the US dominated bond market movements.
The current crude oil futures contract is trading at $101.13 per barrel, fluctuating between $100 and $105, near the middle Bollinger Band. The MACD shows bearish momentum, indicating a potential test of the lower Bollinger Band support in the short term. Oil price movements will continue to be a key variable linking US Treasury yields and the US dollar; any escalating expectations of supply disruptions could amplify upward pressure on yields.
Economic Data Outlook and Short-Term Market Balance
Today will see the release of several data points, including initial jobless claims, the Philadelphia Fed Manufacturing Index, and leading indicators. The market expects limited change in initial jobless claims, indicating a resilient labor market; manufacturing and services PMIs are anticipated to see slight adjustments. Combined with the progress of corporate earnings season, investors are assessing the trade-off between economic resilience and inflation risks.
Combining fundamental and technical factors, support/resistance zones are key to determining short-term trends. The 10-year yield is expected to trade within the 4.56%-4.63% range, while the US dollar index is expected to trade within the 99.20-99.46 range. The evolution of geopolitical variables will determine whether these ranges are effectively broken.
Trend Outlook
Over the next 2-3 days, the US dollar index and US Treasury yields are expected to maintain a high-level, slightly bullish trend. If the situation in Iran continues to lack signs of easing, inflation expectations supported by oil prices will limit the downside for yields, while safe-haven buying of the dollar will also provide a floor. However, technical indicators suggest that bullish momentum has weakened, and a period of consolidation is needed. If subsequent economic data does not significantly improve the resilience of the labor market or exacerbate inflation concerns, the market may seek equilibrium within the current range. The overall logic is consistent with the combination of geopolitically driven caution and expectations of policy tightening; short-term trends still need close monitoring of oil prices and data for verification.
Frequently Asked Questions
How exactly does the tense situation in Iran affect US Treasury yields?
Iran's latest statements have exacerbated market concerns about a potential disruption in the Strait of Hormuz, pushing up oil prices and impacting inflation expectations. Coupled with discussions of policy tightening in the FOMC minutes, investors are demanding higher yields as compensation, causing the 10-year yield to rise to 4.607%. This correlation reflects the amplifying effect of energy prices in the current environment; if oil prices remain high in the short term, yields are likely to experience upward pressure and fluctuations.
What do the current technical signals for the US dollar index mean?
The US dollar index is approaching the upper Bollinger Band. While the price action remains volatile and upward, the MACD indicates a slight weakening of bullish momentum, suggesting resistance around 99.46. Support lies at the middle Bollinger Band around 99.20. Considering its geopolitical safe-haven characteristics, a sharp decline in the dollar is unlikely in the short term, but high-level consolidation is probable. The impact of oil prices and data on risk appetite needs to be closely monitored.
How much has the rise in oil prices changed expectations regarding Federal Reserve policy?
The rebound in oil prices has reinforced concerns about persistent inflation, echoing the majority of officials' statements in the minutes regarding "policy tightening." Market expectations for a hawkish shift in the interest rate path have increased, but the Federal Reserve continues to emphasize its data-dependent approach. Over the next two to three days, oil price movements will be a crucial window for observing changes in policy expectations; if energy prices stabilize and decline, tightening pressures may ease temporarily.
Does the logic of a negative correlation between gold and the US dollar, as well as US Treasury yields, still hold true?
This holds true under the current circumstances. A stronger dollar and rising yields have increased the opportunity cost of holding non-yielding assets, causing spot gold to fall below the middle Bollinger Band. Although gold has inflation-hedging properties, it still faces downward pressure in the short term due to the combined effects of high interest rates and a strong dollar. The strength of any rebound will depend on the pace of geopolitical risk development.
What variables should we pay close attention to in the next 2-3 days to determine the trend?
Key variables include oil price movements, the actual performance of today's economic data (such as initial jobless claims and PMI), and any new developments in geopolitical negotiations. Technically, holding or breaking through the 4.56%-4.63% yield range and the 99.20-99.46 USD range will provide guidance for future direction. Overall, a cautious approach is advised, avoiding over-interpreting cross-market correlations based on a single factor.
- Risk Warning and Disclaimer
- The market involves risk, and trading may not be suitable for all investors. This article is for reference only and does not constitute personal investment advice, nor does it take into account certain users’ specific investment objectives, financial situation, or other needs. Any investment decisions made based on this information are at your own risk.