The two cycles are diverging, and oil prices are awaiting a fundamental breakthrough.
2026-05-22 20:04:11
A comprehensive technical analysis of US crude oil across multiple timeframes (daily and 60-minute charts) reveals that, from a multi-timeframe perspective encompassing daily and hourly charts, US crude oil is currently at a crossroads between a medium-term directional choice and a short-term momentum struggle: the symmetrical triangle consolidation on the daily chart is nearing its end, and the window for a medium-term trend breakout is narrowing; while the hourly chart shows a weak rebound in a state of indecision, with neither bulls nor bears having established a clear one-sided advantage. The following analysis will combine key signals from both timeframes to provide a complete and in-depth analysis.
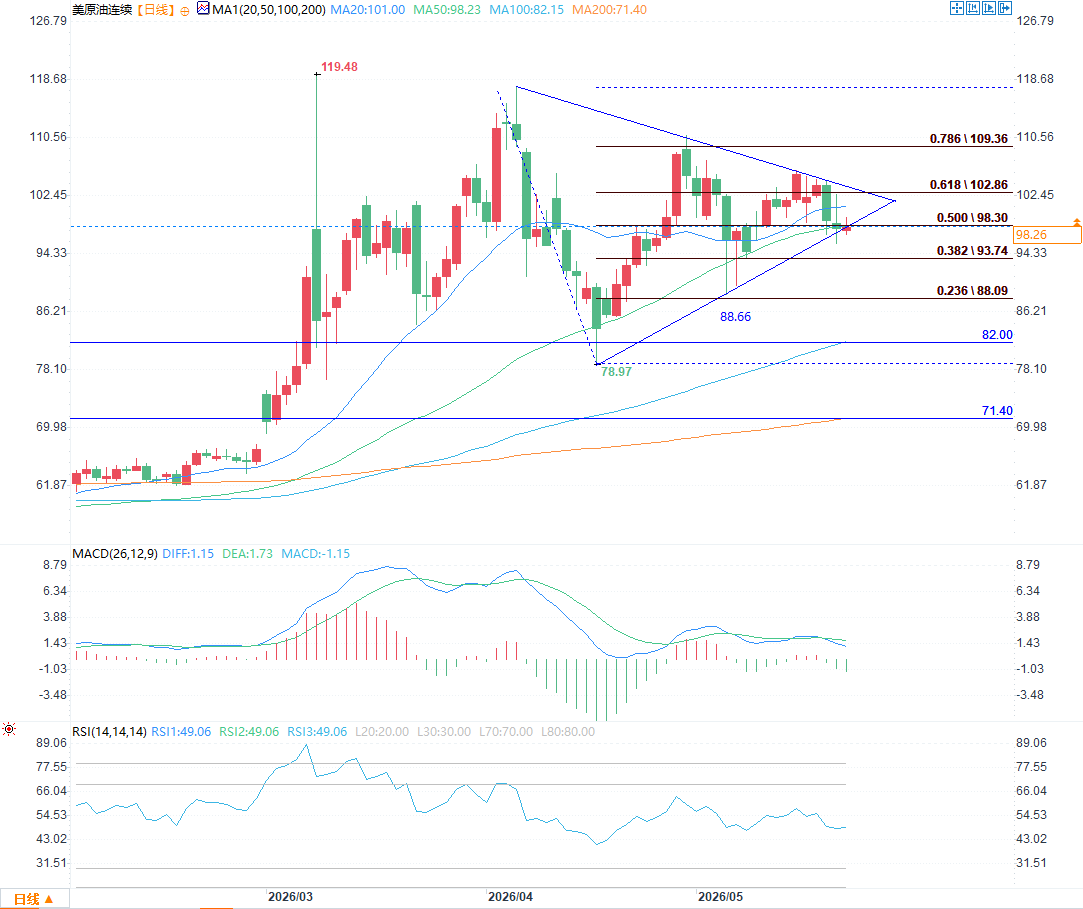
Daily chart: The lower edge of the triangle consolidation pattern is a crucial support level; the medium-term direction awaits a breakout.
(WTI crude oil daily chart source: FX678)
On the daily chart, WTI crude oil prices are currently trading within a clear symmetrical triangle pattern, having just touched the lower support line of the triangle. This level coincides with the 50-day moving average (MA50), forming a double defensive barrier for the medium-term trend. Historically, the MA50 has only been effectively broken once in the past few months, consistently serving as a crucial "lifeline" for the medium-term uptrend and providing strong support during pullbacks, confirming its critical significance. The current price is temporarily stabilizing above this support level without a significant breakout, indicating that the bulls are still attempting to hold this key position, and the price is expected to remain within the consolidation range in the short term. If the price holds the current support and breaks upwards, the resistance levels will advance in tiers according to Fibonacci retracement levels, forming a clear hierarchy of resistance.
The first target is the 50% Fibonacci retracement level at $98.3, which is the dividing line between bullish and bearish trends in the previous downtrend and also the midpoint of the daily chart's triangle consolidation. A break above this level with significant volume would break the current weak consolidation pattern and open up further upside potential. After breaking through $98.3, the next key resistance is the 0.618 Fibonacci level at $102.86, which is also the upper trendline of the triangle consolidation pattern and a key signal to confirm the end of the consolidation. Only a decisive break above this level can confirm the completion of the months-long triangle consolidation and the resumption of the medium-term uptrend.
If the bulls fail to defend and the price breaks down through the current double support, the medium-term trend will face the risk of weakening. The support levels below have also formed a clear defensive echelon: the first stage support is the low point of the previous consolidation platform at $88.66, which is the recent cost concentration area of bullish funds. If this point is broken, it will signal the end of this round of rebound.
After breaking below $88.66, the next important defense line is the $82 level corresponding to the 100-day moving average (MA100). This is a key defensive line for the medium-term trend and an important support for the long-term bullish trend. If $82 also fails to hold, then the previous low of $78.97, the starting point of this upward trend, will become the last strong support level. Once this level is reached, it will open up deeper downside potential. It is worth noting that the current triangle consolidation pattern has reached its end, with the price fluctuation range continuing to narrow. Market sentiment is at its peak, and the window for a directional decision is rapidly approaching. On the fundamental level, developments in the Iranian situation will be the core catalyst for breaking the current balance: the escalation or easing of geopolitical risks in the Middle East will directly determine whether oil prices break through the resistance level upwards or break through the support level downwards. This is a variable that must be closely monitored in subsequent trading.
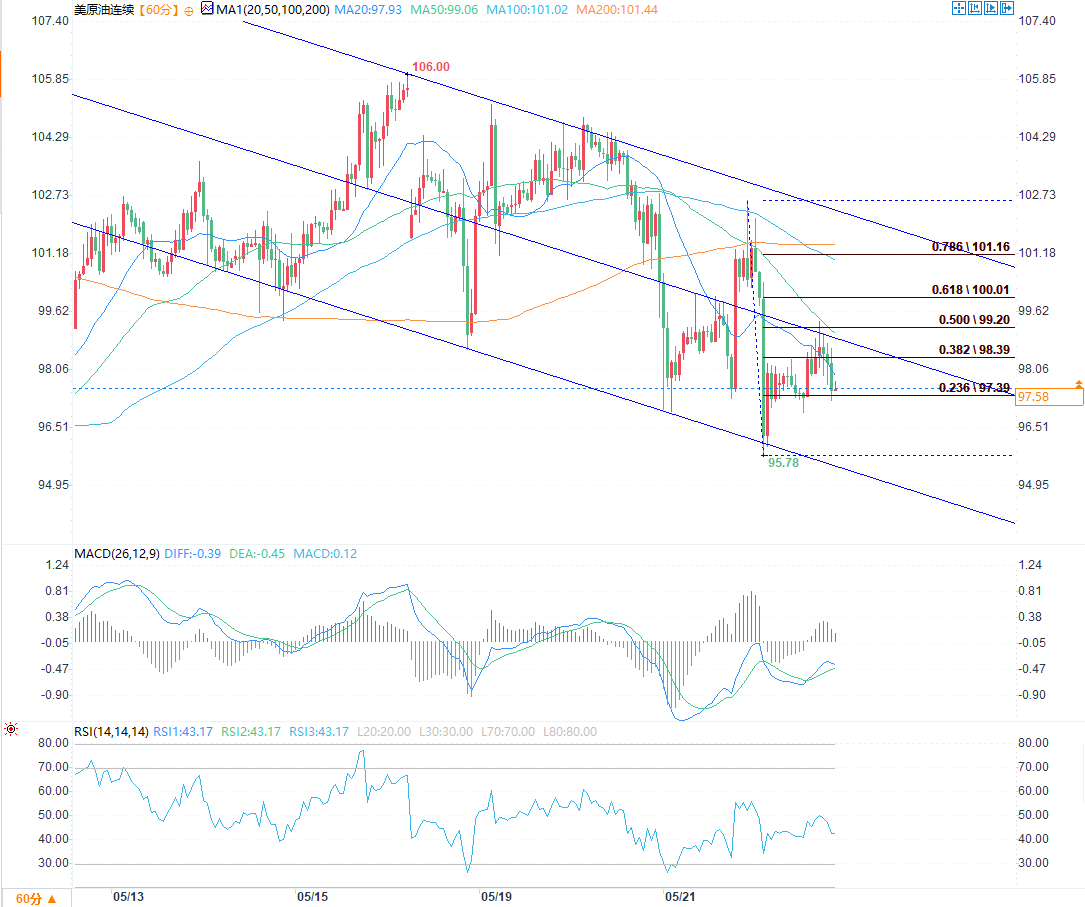
60-minute chart: Hesitant rebound within a downward channel; short-term momentum questionable.
From the short-term trend on the 60-minute chart, the price remains within a clear downward channel, consistently suppressed by the upper channel line, indicating that the short-term downtrend has not been fully reversed. Although the price recently broke through the middle channel line, seemingly signaling a rebound, the movement exhibits a clear "hesitation," lacking sufficient upward momentum. Essentially, it leans more towards a weak recovery after a decline than a trend reversal. Technical indicators also confirm this lack of momentum: while the MACD histogram shows an expansion of red bars, the DIFF line has not yet formed a valid golden cross with the DEA line, and the rebound has been limited, suggesting that the bullish forces are still in a probing phase and have not yet established a sustained offensive rhythm. Although the RSI indicator has rebounded from a low level, it remains below 50 in a neutral-to-bearish range, not entering the strong zone, reflecting a lack of sustained capital inflow for the rebound and that market sentiment has not fully shifted to bullish. Furthermore, the price did not accelerate with increased volume after breaking through the middle channel line, instead oscillating repeatedly near it. This pattern suggests a high probability of a "false breakout," casting doubt on the sustainability of the short-term rebound.
(WTI crude oil 60-minute chart source: FX678)
At key short-term price levels, the relationship between support and resistance is equally clear:
Support levels below: Two key defensive lines
The first support level is the 0.236 Fibonacci retracement level at $97.39. This is the initial support level for the current downward wave and also the immediate defense line for the current price. If this level is broken, it means that the rebound from the middle line of the channel has failed, and the price will return to the downward channel, continuing the short-term weak trend.
The second support level is the previous low of $95.78, which is the low point of this round of decline and an important defense line for the short-term downtrend. Once the price breaks through this level, it will confirm the continuation of the downtrend channel, opening up further downside potential and possibly even causing a break of the daily support level.
Upper resistance: a series of progressively higher resistance levels
The first resistance level is the 0.500 Fibonacci retracement level at $99.20. This is the 50% retracement level of the current downward wave and also the first strong resistance level of the current rebound. For the price to confirm a breakout, it must break through this level with significant volume to break the short-term weakness and open up space to test higher resistance levels.
The second resistance level is the 0.618 Fibonacci retracement level at $100.01. This is the 0.618 Fibonacci retracement level of the downtrend and also a psychologically important psychological level, representing a key point for market sentiment. A break above this level could see the price test the upper resistance of the descending channel.
The third resistance level is the upper channel line near the 0.786 Fibonacci retracement level of $101.16. This is the upper resistance area of the downward channel and also the ultimate resistance level of this round of decline and rebound. Only a valid breakout of this level can confirm that the downward channel has been completely broken, the short-term trend has turned from bearish to bullish, and this, combined with a breakout of the upper trendline of the triangle on the daily chart, will form a multi-timeframe confluence bullish signal.
Summary of Multi-Period Resonance: The Key Game Before Directional Choice
Combining signals from both the daily and hourly charts, oil prices are currently in a state of flux, with both medium-term directional choices and short-term momentum struggles at play. The lower edge of the daily triangle pattern and the hourly support level of $97.39 resonate, forming a crucial support level that bulls must hold. Meanwhile, the upper trendline of the daily triangle and the upper trendline of the hourly channel act as clear resistance for bears. The core contradiction lies in the fact that the daily consolidation is nearing its end, and the market needs fundamental signals to break the equilibrium. However, the weak rebound on the hourly chart indicates that bulls have not yet fully controlled the short-term momentum, and the sustainability of the rebound remains to be seen. In subsequent trading, two key signals should be closely monitored: first, the breaking of daily support and resistance levels; and second, the outcome of the battle between the hourly resistance level of $99.20 and the support level of $97.39. Simultaneously, the marginal changes in the Iranian situation should be closely tracked, awaiting a clear directional signal from the market.
At 19:54 Beijing time, WTI crude oil was trading at $97.62 per barrel, up 1.32%.
Daily chart: The lower edge of the triangle consolidation pattern is a crucial support level; the medium-term direction awaits a breakout.
(WTI crude oil daily chart source: FX678)
On the daily chart, WTI crude oil prices are currently trading within a clear symmetrical triangle pattern, having just touched the lower support line of the triangle. This level coincides with the 50-day moving average (MA50), forming a double defensive barrier for the medium-term trend. Historically, the MA50 has only been effectively broken once in the past few months, consistently serving as a crucial "lifeline" for the medium-term uptrend and providing strong support during pullbacks, confirming its critical significance. The current price is temporarily stabilizing above this support level without a significant breakout, indicating that the bulls are still attempting to hold this key position, and the price is expected to remain within the consolidation range in the short term. If the price holds the current support and breaks upwards, the resistance levels will advance in tiers according to Fibonacci retracement levels, forming a clear hierarchy of resistance.
The first target is the 50% Fibonacci retracement level at $98.3, which is the dividing line between bullish and bearish trends in the previous downtrend and also the midpoint of the daily chart's triangle consolidation. A break above this level with significant volume would break the current weak consolidation pattern and open up further upside potential. After breaking through $98.3, the next key resistance is the 0.618 Fibonacci level at $102.86, which is also the upper trendline of the triangle consolidation pattern and a key signal to confirm the end of the consolidation. Only a decisive break above this level can confirm the completion of the months-long triangle consolidation and the resumption of the medium-term uptrend.
If the bulls fail to defend and the price breaks down through the current double support, the medium-term trend will face the risk of weakening. The support levels below have also formed a clear defensive echelon: the first stage support is the low point of the previous consolidation platform at $88.66, which is the recent cost concentration area of bullish funds. If this point is broken, it will signal the end of this round of rebound.
After breaking below $88.66, the next important defense line is the $82 level corresponding to the 100-day moving average (MA100). This is a key defensive line for the medium-term trend and an important support for the long-term bullish trend. If $82 also fails to hold, then the previous low of $78.97, the starting point of this upward trend, will become the last strong support level. Once this level is reached, it will open up deeper downside potential. It is worth noting that the current triangle consolidation pattern has reached its end, with the price fluctuation range continuing to narrow. Market sentiment is at its peak, and the window for a directional decision is rapidly approaching. On the fundamental level, developments in the Iranian situation will be the core catalyst for breaking the current balance: the escalation or easing of geopolitical risks in the Middle East will directly determine whether oil prices break through the resistance level upwards or break through the support level downwards. This is a variable that must be closely monitored in subsequent trading.
60-minute chart: Hesitant rebound within a downward channel; short-term momentum questionable.
From the short-term trend on the 60-minute chart, the price remains within a clear downward channel, consistently suppressed by the upper channel line, indicating that the short-term downtrend has not been fully reversed. Although the price recently broke through the middle channel line, seemingly signaling a rebound, the movement exhibits a clear "hesitation," lacking sufficient upward momentum. Essentially, it leans more towards a weak recovery after a decline than a trend reversal. Technical indicators also confirm this lack of momentum: while the MACD histogram shows an expansion of red bars, the DIFF line has not yet formed a valid golden cross with the DEA line, and the rebound has been limited, suggesting that the bullish forces are still in a probing phase and have not yet established a sustained offensive rhythm. Although the RSI indicator has rebounded from a low level, it remains below 50 in a neutral-to-bearish range, not entering the strong zone, reflecting a lack of sustained capital inflow for the rebound and that market sentiment has not fully shifted to bullish. Furthermore, the price did not accelerate with increased volume after breaking through the middle channel line, instead oscillating repeatedly near it. This pattern suggests a high probability of a "false breakout," casting doubt on the sustainability of the short-term rebound.
(WTI crude oil 60-minute chart source: FX678)
At key short-term price levels, the relationship between support and resistance is equally clear:
Support levels below: Two key defensive lines
The first support level is the 0.236 Fibonacci retracement level at $97.39. This is the initial support level for the current downward wave and also the immediate defense line for the current price. If this level is broken, it means that the rebound from the middle line of the channel has failed, and the price will return to the downward channel, continuing the short-term weak trend.
The second support level is the previous low of $95.78, which is the low point of this round of decline and an important defense line for the short-term downtrend. Once the price breaks through this level, it will confirm the continuation of the downtrend channel, opening up further downside potential and possibly even causing a break of the daily support level.
Upper resistance: a series of progressively higher resistance levels
The first resistance level is the 0.500 Fibonacci retracement level at $99.20. This is the 50% retracement level of the current downward wave and also the first strong resistance level of the current rebound. For the price to confirm a breakout, it must break through this level with significant volume to break the short-term weakness and open up space to test higher resistance levels.
The second resistance level is the 0.618 Fibonacci retracement level at $100.01. This is the 0.618 Fibonacci retracement level of the downtrend and also a psychologically important psychological level, representing a key point for market sentiment. A break above this level could see the price test the upper resistance of the descending channel.
The third resistance level is the upper channel line near the 0.786 Fibonacci retracement level of $101.16. This is the upper resistance area of the downward channel and also the ultimate resistance level of this round of decline and rebound. Only a valid breakout of this level can confirm that the downward channel has been completely broken, the short-term trend has turned from bearish to bullish, and this, combined with a breakout of the upper trendline of the triangle on the daily chart, will form a multi-timeframe confluence bullish signal.
Summary of Multi-Period Resonance: The Key Game Before Directional Choice
Combining signals from both the daily and hourly charts, oil prices are currently in a state of flux, with both medium-term directional choices and short-term momentum struggles at play. The lower edge of the daily triangle pattern and the hourly support level of $97.39 resonate, forming a crucial support level that bulls must hold. Meanwhile, the upper trendline of the daily triangle and the upper trendline of the hourly channel act as clear resistance for bears. The core contradiction lies in the fact that the daily consolidation is nearing its end, and the market needs fundamental signals to break the equilibrium. However, the weak rebound on the hourly chart indicates that bulls have not yet fully controlled the short-term momentum, and the sustainability of the rebound remains to be seen. In subsequent trading, two key signals should be closely monitored: first, the breaking of daily support and resistance levels; and second, the outcome of the battle between the hourly resistance level of $99.20 and the support level of $97.39. Simultaneously, the marginal changes in the Iranian situation should be closely tracked, awaiting a clear directional signal from the market.
At 19:54 Beijing time, WTI crude oil was trading at $97.62 per barrel, up 1.32%.
- Risk Warning and Disclaimer
- The market involves risk, and trading may not be suitable for all investors. This article is for reference only and does not constitute personal investment advice, nor does it take into account certain users’ specific investment objectives, financial situation, or other needs. Any investment decisions made based on this information are at your own risk.