The US dollar trembled at the 99.5 level overnight! The new Fed chairman was sworn in today, but US Treasury yields suddenly came to a halt…
2026-05-22 20:48:22
On Friday (May 22), the last trading day of the week, US Treasury yields and the US dollar index showed a correlated fluctuation pattern. The 2-year US Treasury yield was last quoted at 4.082%, while the US dollar index was last at around 99.3181. Market focus was on the impact of changes in the Federal Reserve leadership and the macroeconomic environment on the interest rate path. Kevin Warsh will be sworn in as Federal Reserve Chairman at the White House today, and the high inflationary pressures he faces and the expectation of a rise in the neutral interest rate are the core variables driving the current market trend.

From a macro perspective, the expansion of artificial intelligence technology, fiscal deficit pressures, and rising energy costs are collectively pushing up the long-term interest rate level. The pricing of a higher neutral interest rate (R*) in the US Treasury market has shifted from short-term inflation concerns to structural factors. This directly supports the relative strength of the US dollar, but also increases volatility in the bond market. Technically, both are in a high-level consolidation phase within an upward channel, with short-term momentum slowing somewhat.
On the fundamental front, the continuity of Federal Reserve policy is facing a test. The market is closely watching the new Chairman Warsh's previous criticisms of the existing monetary policy framework and his connections with the executive branch, particularly regarding his stance on inflation control. Current inflation has been above the Fed's 2% target for over a year and faces multiple upside risks, including persistently high energy prices and expanding infrastructure investment demand. These factors collectively point to a potential permanent rise in the neutral interest rate.
An analysis by a well-known institution points out that expanding fiscal deficits, increased government borrowing demand, and capital expenditures related to artificial intelligence will drive the economy to operate in a higher real interest rate environment without triggering a recession. This means the Federal Reserve may need to maintain higher policy rates in the future, and even maintain a tightening bias after inflation eases. Market expectations for the Fed's June meeting have been adjusted accordingly, increasing uncertainty about the interest rate path in the dot plot.
Against this backdrop, the movement of US Treasury yields directly impacts the US dollar index. The 2-year US Treasury yield began its upward trend from a mid-April low of 3.678%, accelerating its rise since May, and is currently fluctuating at a high level within the 4.0%-4.15% range. Rising yields typically enhance the attractiveness of the US dollar, supporting its exchange rate by increasing the return on holding dollar-denominated assets.
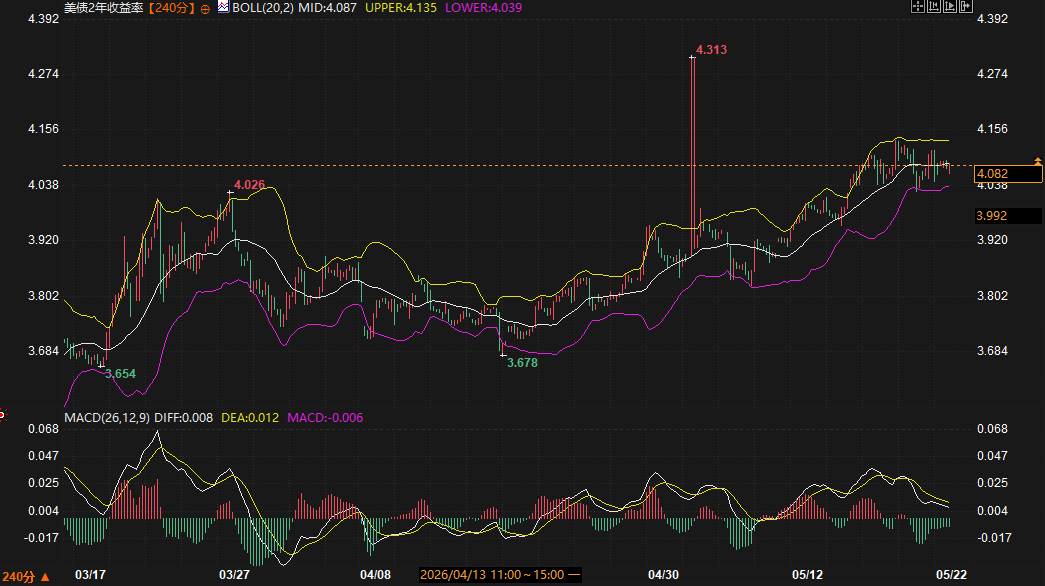
From a technical perspective, the 240-minute chart for the 2-year US Treasury yield shows Bollinger Bands with a parameter of 20, an upper band at 4.135%, a middle band at 4.087%, and a lower band at 4.039%. The current price is close to the middle band and near the upper band resistance, remaining within an upward channel. In the MACD indicator (26,12,9), the DIFF is slightly lower than the DEA, the MACD value is -0.006, and a small green histogram appears, indicating a slight weakening of short-term upward momentum, but the overall bullish trend remains intact.
From a candlestick chart perspective, after falling from the late March high of 4.026% to 3.678%, the price has risen by approximately 40 basis points. Recently, the price has been oscillating upwards along the upper Bollinger Band, with limited pullbacks. Strong resistance exists around the 4.13% Fibonacci retracement level. This level is close to a previous high-volume area, and a breakout would require sustained fundamental catalysts.
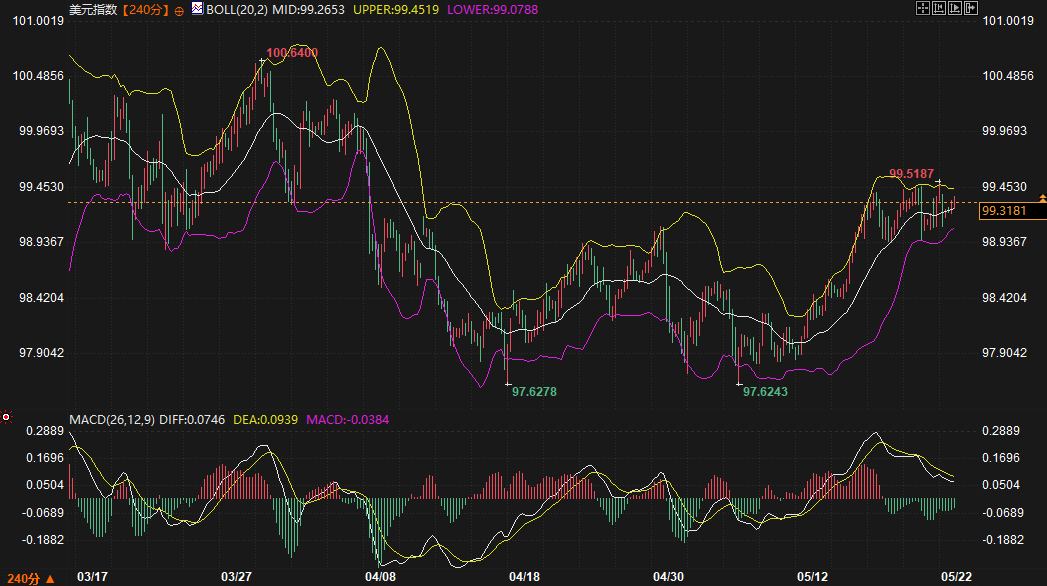
Regarding the US Dollar Index, the latest price on the 240-minute chart is 99.3181, with a high of 100.6400 and a low of 97.6243. The Bollinger Bands have an upper band at 99.4519, a middle band at 99.2653, and a lower band at 99.0788. The price is currently between the middle and upper bands, approaching the upper band resistance. The MACD indicator shows the DIFF line is below the DEA line, the MACD value is -0.0384, and the green bars persist, indicating a short-term pullback in momentum and a post-uptrend correction phase.
The overall trend of the candlestick chart shows that after two rounds of decline in March and April, the price stabilized around 97.62, and a reversal began in late April, with a cumulative increase of nearly 200 points in May. Currently, it has reached a resistance level around 99.5, which is a previous area of high trading volume and faces significant selling pressure. The short-term pattern shows an upward oscillation along the upper Bollinger Band, with a clear range-bound movement between 99.3 and 99.5.
Support and resistance levels are predicted based on the US Dollar Index main contract: Support is expected in the 99.0788 (lower Bollinger Band) to 98.9 area, which corresponds to the starting point of the previous rebound and a key level protecting the bullish trend. Resistance is expected in the 99.4519 (upper Bollinger Band) to 99.6 area, a densely traded zone near the previous high. Key points to watch during the session include the release of speeches by Federal Reserve officials and the immediate reaction to the leading economic index and the Michigan Consumer Sentiment Index. If yields continue to fluctuate at high levels, the US Dollar Index is likely to hold its middle Bollinger Band support; conversely, if profit-taking occurs in the bond market, the dollar may test the lower Bollinger Band.
In summary, the impact of US Treasury yields on the US dollar is logically clear: the continued upward trend in yields will provide fundamental support for the dollar, but the high-level fluctuations also mean that downward pressure exists. Market interpretation of the new Federal Reserve Chairman's policy stance will be the main driver of short-term volatility.
Looking ahead, the central level of US Treasury yields is expected to gradually rise, driven by structural factors, but will remain in a high-level range-bound movement in the short term. The US dollar index may continue its positive correlation with yields, fluctuating in both directions within the 99.0-99.6 range. Key attention will be paid to data verification and policy signals ahead of the June Fed meeting. If the consensus on a rising neutral interest rate strengthens, the dollar will receive additional support; conversely, if easing geopolitical factors lead to a bond market recovery, the dollar's downward pressure may increase. Overall, the market will likely remain within a trend channel, requiring continuous monitoring of how fundamental variables validate technical patterns.
1. What is the transmission mechanism of rising US Treasury yields to the US dollar index?
Rising US Treasury yields typically increase the attractiveness of dollar-denominated assets, drawing in capital inflows through interest rate differentials and supporting the dollar's exchange rate. In the current environment, the structural increase in R* further reinforces this logic, but attention should be paid to potential profit-taking pressure after reaching higher levels.
2. What signals does the current technical pattern of the 2-year US Treasury yield indicate?
The price is trading within the Bollinger Band's upward channel, and the MACD's short-term momentum is weakening, indicating a continuation of the bullish trend but facing resistance at the upper band. The 4.13% Fibonacci retracement level is a key resistance point; whether it is broken or not will determine the direction in the next phase.
3. How will changes in the Federal Reserve leadership affect bond market expectations?
The new chairman's challenges in controlling inflation and the market's observation of policy continuity may lead to increased short-term volatility. Institutional views tend to suggest that the bond market has already begun pricing in a higher long-term interest rate environment, which indirectly benefits the US dollar.
4. What is the significance of the current resistance level for the US dollar index?
The area around 99.5 is a previous area of high trading volume. A breakthrough of this level requires a simultaneous break above key resistance levels in yields. Until then, the market is likely to remain volatile; pay close attention to the market's reaction after data releases.
5. Which macroeconomic variables should be closely monitored in the short term?
We need to pay attention to leading economic indicators, consumer confidence data, and speeches by Federal Reserve officials. These variables will directly affect the market's pricing of interest rate paths, which in turn will affect the correlation between US Treasury yields and the US dollar.
From a macro perspective, the expansion of artificial intelligence technology, fiscal deficit pressures, and rising energy costs are collectively pushing up the long-term interest rate level. The pricing of a higher neutral interest rate (R*) in the US Treasury market has shifted from short-term inflation concerns to structural factors. This directly supports the relative strength of the US dollar, but also increases volatility in the bond market. Technically, both are in a high-level consolidation phase within an upward channel, with short-term momentum slowing somewhat.
Fundamental and technical analysis
On the fundamental front, the continuity of Federal Reserve policy is facing a test. The market is closely watching the new Chairman Warsh's previous criticisms of the existing monetary policy framework and his connections with the executive branch, particularly regarding his stance on inflation control. Current inflation has been above the Fed's 2% target for over a year and faces multiple upside risks, including persistently high energy prices and expanding infrastructure investment demand. These factors collectively point to a potential permanent rise in the neutral interest rate.
An analysis by a well-known institution points out that expanding fiscal deficits, increased government borrowing demand, and capital expenditures related to artificial intelligence will drive the economy to operate in a higher real interest rate environment without triggering a recession. This means the Federal Reserve may need to maintain higher policy rates in the future, and even maintain a tightening bias after inflation eases. Market expectations for the Fed's June meeting have been adjusted accordingly, increasing uncertainty about the interest rate path in the dot plot.
Against this backdrop, the movement of US Treasury yields directly impacts the US dollar index. The 2-year US Treasury yield began its upward trend from a mid-April low of 3.678%, accelerating its rise since May, and is currently fluctuating at a high level within the 4.0%-4.15% range. Rising yields typically enhance the attractiveness of the US dollar, supporting its exchange rate by increasing the return on holding dollar-denominated assets.
From a technical perspective, the 240-minute chart for the 2-year US Treasury yield shows Bollinger Bands with a parameter of 20, an upper band at 4.135%, a middle band at 4.087%, and a lower band at 4.039%. The current price is close to the middle band and near the upper band resistance, remaining within an upward channel. In the MACD indicator (26,12,9), the DIFF is slightly lower than the DEA, the MACD value is -0.006, and a small green histogram appears, indicating a slight weakening of short-term upward momentum, but the overall bullish trend remains intact.
From a candlestick chart perspective, after falling from the late March high of 4.026% to 3.678%, the price has risen by approximately 40 basis points. Recently, the price has been oscillating upwards along the upper Bollinger Band, with limited pullbacks. Strong resistance exists around the 4.13% Fibonacci retracement level. This level is close to a previous high-volume area, and a breakout would require sustained fundamental catalysts.
Regarding the US Dollar Index, the latest price on the 240-minute chart is 99.3181, with a high of 100.6400 and a low of 97.6243. The Bollinger Bands have an upper band at 99.4519, a middle band at 99.2653, and a lower band at 99.0788. The price is currently between the middle and upper bands, approaching the upper band resistance. The MACD indicator shows the DIFF line is below the DEA line, the MACD value is -0.0384, and the green bars persist, indicating a short-term pullback in momentum and a post-uptrend correction phase.
The overall trend of the candlestick chart shows that after two rounds of decline in March and April, the price stabilized around 97.62, and a reversal began in late April, with a cumulative increase of nearly 200 points in May. Currently, it has reached a resistance level around 99.5, which is a previous area of high trading volume and faces significant selling pressure. The short-term pattern shows an upward oscillation along the upper Bollinger Band, with a clear range-bound movement between 99.3 and 99.5.
Support and resistance levels are predicted based on the US Dollar Index main contract: Support is expected in the 99.0788 (lower Bollinger Band) to 98.9 area, which corresponds to the starting point of the previous rebound and a key level protecting the bullish trend. Resistance is expected in the 99.4519 (upper Bollinger Band) to 99.6 area, a densely traded zone near the previous high. Key points to watch during the session include the release of speeches by Federal Reserve officials and the immediate reaction to the leading economic index and the Michigan Consumer Sentiment Index. If yields continue to fluctuate at high levels, the US Dollar Index is likely to hold its middle Bollinger Band support; conversely, if profit-taking occurs in the bond market, the dollar may test the lower Bollinger Band.
In summary, the impact of US Treasury yields on the US dollar is logically clear: the continued upward trend in yields will provide fundamental support for the dollar, but the high-level fluctuations also mean that downward pressure exists. Market interpretation of the new Federal Reserve Chairman's policy stance will be the main driver of short-term volatility.
Future Trend Outlook
Looking ahead, the central level of US Treasury yields is expected to gradually rise, driven by structural factors, but will remain in a high-level range-bound movement in the short term. The US dollar index may continue its positive correlation with yields, fluctuating in both directions within the 99.0-99.6 range. Key attention will be paid to data verification and policy signals ahead of the June Fed meeting. If the consensus on a rising neutral interest rate strengthens, the dollar will receive additional support; conversely, if easing geopolitical factors lead to a bond market recovery, the dollar's downward pressure may increase. Overall, the market will likely remain within a trend channel, requiring continuous monitoring of how fundamental variables validate technical patterns.
Frequently Asked Questions
1. What is the transmission mechanism of rising US Treasury yields to the US dollar index?
Rising US Treasury yields typically increase the attractiveness of dollar-denominated assets, drawing in capital inflows through interest rate differentials and supporting the dollar's exchange rate. In the current environment, the structural increase in R* further reinforces this logic, but attention should be paid to potential profit-taking pressure after reaching higher levels.
2. What signals does the current technical pattern of the 2-year US Treasury yield indicate?
The price is trading within the Bollinger Band's upward channel, and the MACD's short-term momentum is weakening, indicating a continuation of the bullish trend but facing resistance at the upper band. The 4.13% Fibonacci retracement level is a key resistance point; whether it is broken or not will determine the direction in the next phase.
3. How will changes in the Federal Reserve leadership affect bond market expectations?
The new chairman's challenges in controlling inflation and the market's observation of policy continuity may lead to increased short-term volatility. Institutional views tend to suggest that the bond market has already begun pricing in a higher long-term interest rate environment, which indirectly benefits the US dollar.
4. What is the significance of the current resistance level for the US dollar index?
The area around 99.5 is a previous area of high trading volume. A breakthrough of this level requires a simultaneous break above key resistance levels in yields. Until then, the market is likely to remain volatile; pay close attention to the market's reaction after data releases.
5. Which macroeconomic variables should be closely monitored in the short term?
We need to pay attention to leading economic indicators, consumer confidence data, and speeches by Federal Reserve officials. These variables will directly affect the market's pricing of interest rate paths, which in turn will affect the correlation between US Treasury yields and the US dollar.
- Risk Warning and Disclaimer
- The market involves risk, and trading may not be suitable for all investors. This article is for reference only and does not constitute personal investment advice, nor does it take into account certain users’ specific investment objectives, financial situation, or other needs. Any investment decisions made based on this information are at your own risk.