Will the US dollar see a major move at the 99 level? A four-pronged attack from the Middle East, oil prices, PCE, and the Fed.
2026-05-26 17:22:31
On Tuesday, May 26, the US dollar index fluctuated around 99, still higher than the low of around 98.92 reached in the previous trading day. The dollar has strengthened slightly by about 0.57% in the past month, but has retreated slightly over the past 12 months, and technically it is in a state of sideways consolidation after recovering from the low.
What's most noteworthy in the current market isn't the daily fluctuation of the US dollar index itself, but rather that it hasn't significantly weakened despite improved sentiment towards risk assets. Traditionally, if expectations of easing tensions in the Middle East lead to decreased demand for safe-haven assets, the dollar typically comes under pressure; however, the current dollar performance seems more like a shift from a "safe-haven premium" to an "inflation premium" and an "interest rate premium."
This means traders are no longer solely focused on the progress of the conflict, but are assessing the transmission of energy price shocks to inflation, interest rates, and real yields. Market news indicates that uncertainty remains in the US-Iran peace negotiations. Although the dollar index briefly fell to around 98.9, it subsequently found support, suggesting that the bears have not exerted sustained pressure.
From a daily chart perspective, the US dollar index previously formed a temporary low in the 97.6-97.8 range, subsequently rebounding to around 99.5, and is currently fluctuating around the 99 level. The Bollinger Band middle line is around 98.64, the upper line is around 99.53, and the lower line is around 97.76. The price remains above the middle line, indicating that the short-term recovery structure has not been broken, but the resistance around 99.5 is also quite clear.
The current strengthening of the US dollar is not solely due to safe-haven buying. A deeper logic lies in the fact that high energy prices are transmitted to macroeconomic data through transportation costs, business input costs, and household inflation expectations. Even as the conflict gradually subsides, the cost pressures created by previous oil price increases may still be reflected in the inflation chain with a lag.
The challenge in this environment lies in the fact that the US dollar possesses two conflicting attributes. On the one hand, a de-escalation of tensions weakens demand for safe-haven assets; on the other hand, high oil prices strengthen inflation expectations and interest rate support. Therefore, the US dollar index is unlikely to exhibit a one-sided trend and is more likely to repeatedly reprice itself around key data and policy expectations.
Recent remarks by Federal Reserve official Waller have reinforced market focus on inflation expectations. In his comments on the economic outlook, he noted that a series of positive price shocks could lead the public to infer that the next price shock is more likely to be upward-biased, thereby pushing up inflation expectations, even if these shocks are considered temporary.
The importance of this statement lies in shifting the market focus from "whether oil prices will continue to rise" to "whether oil prices have already changed inflation expectations." Once inflation expectations resurface, even without immediate action, the Federal Reserve will find it difficult to quickly shift to an easing stance. Recent market discussions also indicate that the possibility of another 25 basis point rate hike this year has been reintroduced into the pricing framework.
The currently released PCE data shows that the PCE price index rose 3.5% year-on-year in March, higher than February's 2.8%; the core PCE rose to 3.2% year-on-year, also higher than February's 3.0%. The next PCE data release is scheduled for May 28, which will directly affect the market's judgment on the Federal Reserve's policy path.
From the daily chart, the US dollar index stabilized around 97.6, and the rebound was accompanied by a strengthening MACD, with the DIFF at approximately 0.1383 and the DEA at approximately 0.0563. The histogram remains above the zero line, indicating that short-term momentum has not completely subsided. However, the price encountered resistance around 99.5 and fell back, indicating that selling pressure has begun to emerge.
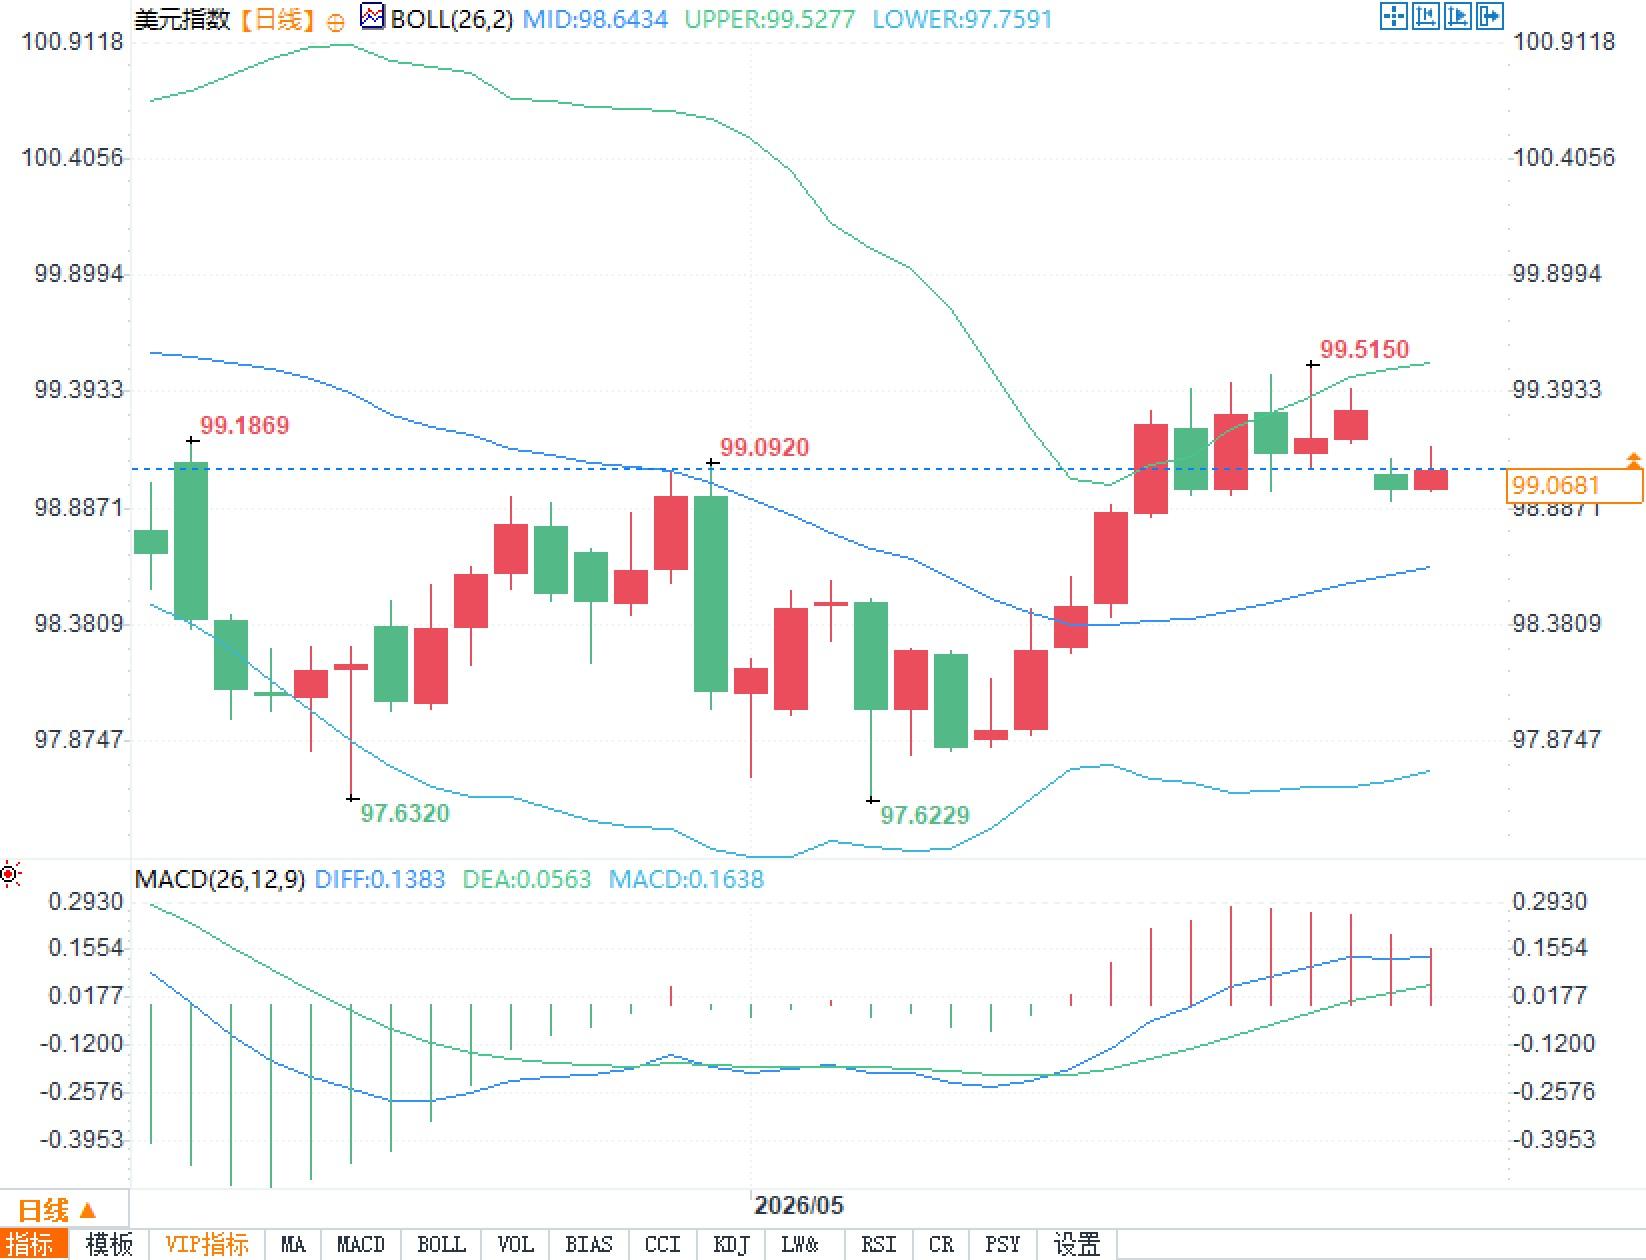
The current key range is 98.6 to 99.5. The area around 98.6 corresponds to the Bollinger Band's middle line and is also a reference area for short-term strength/weakness reversals; the area around 99.5 is close to the recent high and the upper Bollinger Band. If the US dollar index continues to trade above the middle line, the market will still view it as a consolidation with a slightly bullish bias; if it falls back below 98.6, it means that the previous rebound driven by interest rate expectations needs to be retested.
More importantly, the current dollar index movement is not purely technical, but rather driven by PCE, employment, oil prices, and progress in Middle East negotiations. Traders are wary of a scenario where risk assets continue to rise while the dollar remains strong. This combination often indicates that the market is not entirely ignoring risk, but rather seeking a balance between higher nominal growth and stickier inflation.
Question 1: Why hasn't the US dollar index fallen significantly despite rising expectations of easing tensions in the Middle East?
A: Because the market's main trading theme has shifted from simple risk aversion to inflation and interest rate expectations. Easing tensions will weaken safe-haven buying, but inflationary pressures from high oil prices may force the Federal Reserve to maintain a tight stance, thus supporting the dollar.
Question 2: Why is PCE data so crucial for the US dollar?
A: PCE is a key inflation indicator that the Federal Reserve closely monitors. The March PCE year-on-year growth rate was 3.5%, and the core PCE rate was 3.2%. If subsequent data continues to be strong, the market will reassess the likelihood of the Federal Reserve maintaining high interest rates or even further tightening.
Question 3: How should the current technical aspects of the US dollar index be interpreted?
A: The daily chart shows that the US dollar index is still above the middle Bollinger Band, and the MACD remains positive, indicating that the short-term recovery structure has not been broken. However, there is resistance around 99.5, and the area around 98.6 is an important dividing line between strength and weakness.
The US dollar did not fully follow the weakening trend in risk appetite.
What's most noteworthy in the current market isn't the daily fluctuation of the US dollar index itself, but rather that it hasn't significantly weakened despite improved sentiment towards risk assets. Traditionally, if expectations of easing tensions in the Middle East lead to decreased demand for safe-haven assets, the dollar typically comes under pressure; however, the current dollar performance seems more like a shift from a "safe-haven premium" to an "inflation premium" and an "interest rate premium."
This means traders are no longer solely focused on the progress of the conflict, but are assessing the transmission of energy price shocks to inflation, interest rates, and real yields. Market news indicates that uncertainty remains in the US-Iran peace negotiations. Although the dollar index briefly fell to around 98.9, it subsequently found support, suggesting that the bears have not exerted sustained pressure.
From a daily chart perspective, the US dollar index previously formed a temporary low in the 97.6-97.8 range, subsequently rebounding to around 99.5, and is currently fluctuating around the 99 level. The Bollinger Band middle line is around 98.64, the upper line is around 99.53, and the lower line is around 97.76. The price remains above the middle line, indicating that the short-term recovery structure has not been broken, but the resistance around 99.5 is also quite clear.
Oil price shocks are changing the core of foreign exchange pricing.
The current strengthening of the US dollar is not solely due to safe-haven buying. A deeper logic lies in the fact that high energy prices are transmitted to macroeconomic data through transportation costs, business input costs, and household inflation expectations. Even as the conflict gradually subsides, the cost pressures created by previous oil price increases may still be reflected in the inflation chain with a lag.
The challenge in this environment lies in the fact that the US dollar possesses two conflicting attributes. On the one hand, a de-escalation of tensions weakens demand for safe-haven assets; on the other hand, high oil prices strengthen inflation expectations and interest rate support. Therefore, the US dollar index is unlikely to exhibit a one-sided trend and is more likely to repeatedly reprice itself around key data and policy expectations.
The Federal Reserve's expectations are providing implicit support for the dollar.
Recent remarks by Federal Reserve official Waller have reinforced market focus on inflation expectations. In his comments on the economic outlook, he noted that a series of positive price shocks could lead the public to infer that the next price shock is more likely to be upward-biased, thereby pushing up inflation expectations, even if these shocks are considered temporary.
The importance of this statement lies in shifting the market focus from "whether oil prices will continue to rise" to "whether oil prices have already changed inflation expectations." Once inflation expectations resurface, even without immediate action, the Federal Reserve will find it difficult to quickly shift to an easing stance. Recent market discussions also indicate that the possibility of another 25 basis point rate hike this year has been reintroduced into the pricing framework.
The currently released PCE data shows that the PCE price index rose 3.5% year-on-year in March, higher than February's 2.8%; the core PCE rose to 3.2% year-on-year, also higher than February's 3.0%. The next PCE data release is scheduled for May 28, which will directly affect the market's judgment on the Federal Reserve's policy path.
Technical analysis indicates the US dollar has entered a stress test zone.
From the daily chart, the US dollar index stabilized around 97.6, and the rebound was accompanied by a strengthening MACD, with the DIFF at approximately 0.1383 and the DEA at approximately 0.0563. The histogram remains above the zero line, indicating that short-term momentum has not completely subsided. However, the price encountered resistance around 99.5 and fell back, indicating that selling pressure has begun to emerge.
The current key range is 98.6 to 99.5. The area around 98.6 corresponds to the Bollinger Band's middle line and is also a reference area for short-term strength/weakness reversals; the area around 99.5 is close to the recent high and the upper Bollinger Band. If the US dollar index continues to trade above the middle line, the market will still view it as a consolidation with a slightly bullish bias; if it falls back below 98.6, it means that the previous rebound driven by interest rate expectations needs to be retested.
More importantly, the current dollar index movement is not purely technical, but rather driven by PCE, employment, oil prices, and progress in Middle East negotiations. Traders are wary of a scenario where risk assets continue to rise while the dollar remains strong. This combination often indicates that the market is not entirely ignoring risk, but rather seeking a balance between higher nominal growth and stickier inflation.
Frequently Asked Questions
Question 1: Why hasn't the US dollar index fallen significantly despite rising expectations of easing tensions in the Middle East?
A: Because the market's main trading theme has shifted from simple risk aversion to inflation and interest rate expectations. Easing tensions will weaken safe-haven buying, but inflationary pressures from high oil prices may force the Federal Reserve to maintain a tight stance, thus supporting the dollar.
Question 2: Why is PCE data so crucial for the US dollar?
A: PCE is a key inflation indicator that the Federal Reserve closely monitors. The March PCE year-on-year growth rate was 3.5%, and the core PCE rate was 3.2%. If subsequent data continues to be strong, the market will reassess the likelihood of the Federal Reserve maintaining high interest rates or even further tightening.
Question 3: How should the current technical aspects of the US dollar index be interpreted?
A: The daily chart shows that the US dollar index is still above the middle Bollinger Band, and the MACD remains positive, indicating that the short-term recovery structure has not been broken. However, there is resistance around 99.5, and the area around 98.6 is an important dividing line between strength and weakness.
- Risk Warning and Disclaimer
- The market involves risk, and trading may not be suitable for all investors. This article is for reference only and does not constitute personal investment advice, nor does it take into account certain users’ specific investment objectives, financial situation, or other needs. Any investment decisions made based on this information are at your own risk.