The US dollar has formed a death cross, gold is approaching oversold territory, and the calm under the US-Iran conflict is about to be broken.
2026-05-26 20:44:12
On Tuesday (May 26), the US dollar index hovered around 99.1130, while US Treasury yields saw a significant decline. After reaching a high of 99.5187 in mid-May, the US dollar index entered a period of high-level consolidation and is currently near the middle Bollinger Band. Meanwhile, US Treasury yields have fluctuated with oil prices, reflecting a divergence in market interpretations of the Middle East situation. Over the weekend and recently, while military strikes occurred between the US and Iran, news of related peace negotiations has also circulated. Gold, as an asset negatively correlated with the US dollar, is currently in a second dip phase after a rebound, showing oversold characteristics in the short term. The overall market presents a complex picture of geopolitical disturbances and policy expectations, and the interim performance of the US dollar and US Treasury yields in cross-market interactions warrants attention.

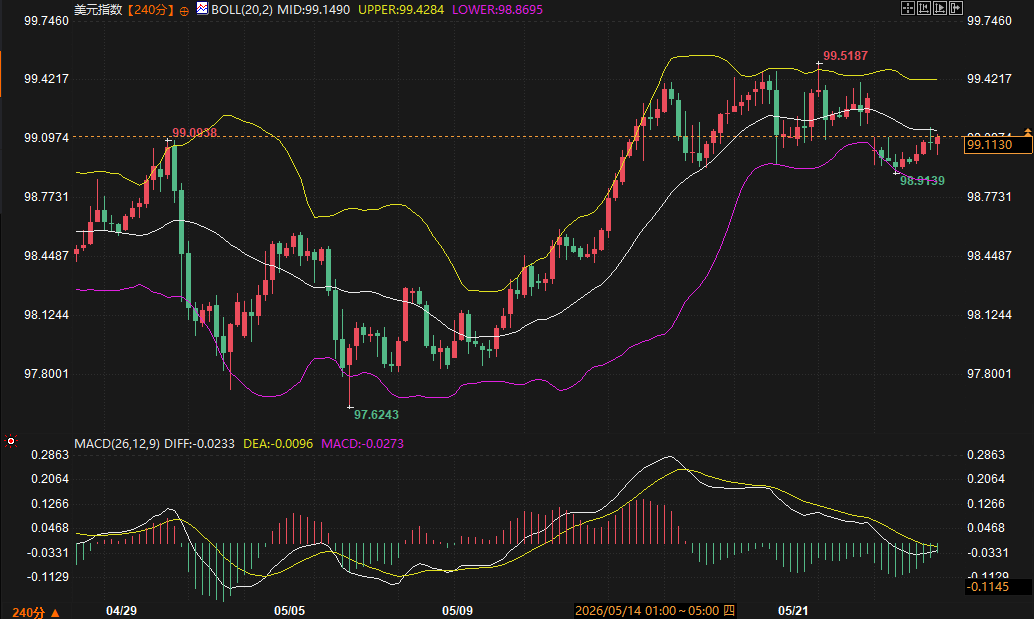
The US dollar index is currently at 99.1130, with a high of 99.5187 and a low of 97.6243 within the period. The previous high resistance level is at 99.0938. The Bollinger Bands (20,2) show an upper band of 99.4284, a middle band of 99.1490, and a lower band of 98.8695. The price is trading near the middle band, and the Bollinger Bands are narrowing, indicating that the previous upward momentum has significantly weakened and a sideways trading pattern has emerged.
The MACD (26,12,9) indicator shows the DIFF line crossing below the DEA line, forming a death cross, and the MACD histogram is gradually expanding, indicating increased short-term bearish momentum. In terms of candlestick patterns, the US dollar index, after rising from 97.6243 in early May, encountered resistance at 99.5187 and fell back, rebounding after testing the lower Bollinger Band. Currently, it is facing pressure near the middle Bollinger Band, and the bullish trend is showing signs of fatigue. Short-term support levels to watch are 98.8695 (lower Bollinger Band) and 98.9139, while resistance levels are 99.1490 (middle Bollinger Band) and 99.5187. Data shows that if the price continues to trade below the middle Bollinger Band, the probability of a weak and volatile market will gradually increase.
In the US Treasury market, yields declined, with the 10-year Treasury yield exhibiting a two-way range of 4.60%-4.55% in the short term. Oil price volatility drove yield adjustments, and the market also remained focused on related diplomatic developments alongside recent military strikes. The UK 5-year and 30-year yield curve steepened slightly, with the 5-year yield triggering a double-top pattern, targeting a pullback to 4.12%, indicating that long-term interest rates in developed markets are facing overall adjustment pressure.
This trend is in tandem with the US dollar index: Amidst a high-level fluctuation in the dollar, adjustments in US Treasury yields reflect investors' dynamic pricing of geopolitical risks, while also highlighting the limited space for fiscal and monetary policy. Leading foreign media outlets point out that policymakers' ability to respond to shocks has diminished, and the impact of fiscal vulnerability on the sovereign debt market is gradually becoming apparent. In the short term, yield fluctuations will have some impact on the dollar, but geopolitical uncertainties will keep the trend cautious.
The latest spot gold price is 4509.57, with a high of 4773.37 (early May) and a low of 4453.60 (late May) within the same period. The Bollinger Bands (20,2) have an upper band of 4579.72, a middle band of 4536.25, and a lower band of 4492.78. The price is close to the lower band, indicating a short-term oversold condition. The Bollinger Bands are widening downwards, suggesting a short-term bearish trend. The MACD shows the DIFF line below the DEA line, with persistent green bars, indicating continued bearish momentum. However, the indicator is near its low, suggesting a potential rebound.
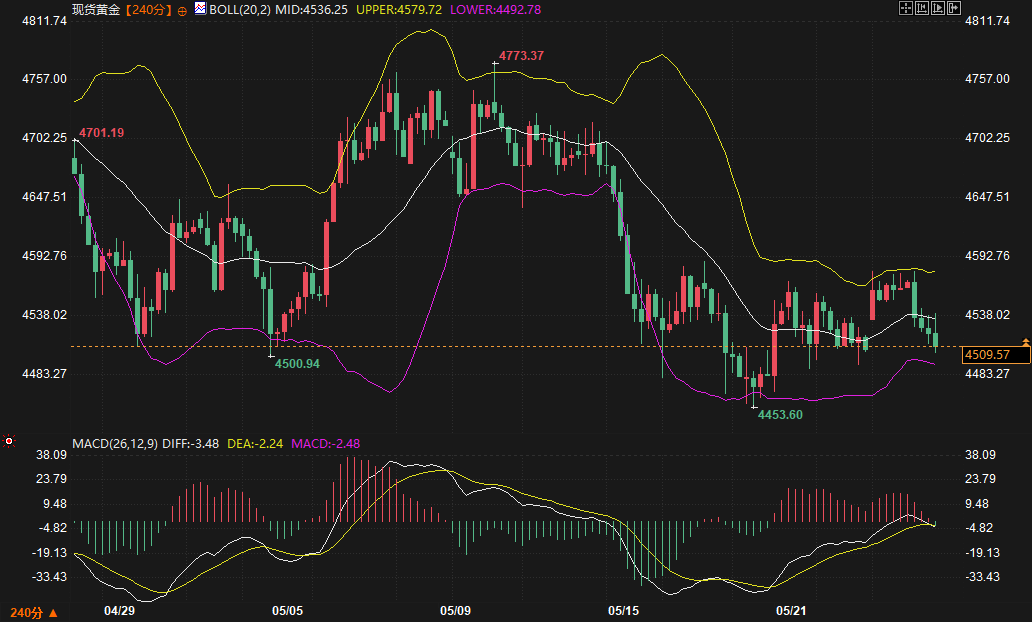
The candlestick pattern shows a post-decline consolidation pattern: after peaking in early May, it fell rapidly, rebounded slightly to around 4580 before encountering resistance, and then fell back to a second bottoming phase. Short-term support levels are 4492.78 (lower Bollinger Band) and 4453.60, while resistance levels are 4536.25 (middle Bollinger Band) and 4580. Data shows that gold and the US dollar index typically exhibit a negative correlation: if the dollar weakens, it will provide technical support for gold; conversely, if the dollar remains strong, gold will continue to face pressure. This negative correlation is currently being validated, becoming an important auxiliary indicator for observing the strength of the US dollar.
Geopolitically, tensions in the Strait of Hormuz have hampered trade and aid, increased energy price volatility, and disrupted global supply chains. The coexistence of military action and diplomatic efforts makes risk premiums prone to fluctuations. On the economic data front, the upcoming consumer confidence index, house price index, and regional central bank manufacturing surveys will be key focuses. European Central Bank officials have emphasized that even with developments, a June rate hike is still necessary, indicating a divergence in policy paths among major economies.
On the supply side of US Treasury bonds, there are still a significant number of short-term and two-year notes up for auction this week. Coupled with fiscal spending pressures, the yield curve is likely to be influenced by the supply side. Overall, the fundamental factors constraining the US dollar and US Treasury yields are mainly reflected in the pricing of geopolitical risks and the interplay of policy expectations. A one-sided trend is unlikely in the short term, and range-bound trading is more probable.
Based on the above technical and fundamental analysis, the US dollar index is expected to continue fluctuating within the 98.87-99.43 range over the next 2-3 days. A break below the 99.1490 midline could test the 98.87-98.91 support zone; conversely, a hold above the midline would target resistance at 99.52. US Treasury yields are expected to maintain a two-way range, with the 10-year yield fluctuating around 4.55%-4.60%. Geopolitical developments and data releases will dominate short-term direction. Gold, as a correlated indicator, may seek a rebound within the 4493-4536 range if the dollar weakens. Overall, the market is expected to trade within a range in the short term, requiring close monitoring of the latest geopolitical developments, oil price fluctuations, and the impact of key economic data on cross-market correlations.
Does the current death cross signal in the US dollar index indicate a reversal in the medium-term trend?
The current MACD death cross mainly reflects the strengthening of short-term bearish momentum, but the US dollar is still in a high-level consolidation phase within the upward trend that began in May. The narrowing Bollinger Bands indicate that the trend has shifted from a one-sided move to consolidation, rather than a clear medium-term reversal signal. It is necessary to observe whether the 98.87 support level is effectively broken. If it only fluctuates around the middle band, then the market will likely remain in a high-level consolidation phase.
What factors have driven the recent volatility in US Treasury yields?
Primarily influenced by oil price fluctuations and dynamic geopolitical events, the coexistence of military strikes and related diplomatic news led to divergent market interpretations. Fiscal vulnerability and limited policy space also constrained long-term yields, resulting in an overall range-bound trading pattern.
What implications do the oversold technical indicators of gold have for the US dollar's trajectory?
Gold is approaching the lower Bollinger Band and the MACD indicator is near a low level, suggesting a potential rebound. If gold achieves a corrective rebound, it often corresponds to a temporary weakening of the US dollar, confirming the negative correlation between the two. This signal can serve as a supplementary indicator for observing the short-term strength or weakness of the US dollar, but it needs to be judged in conjunction with the US dollar's own Bollinger Bands and MACD indicators.
What are the key risks in the next 2-3 days?
Key focus will be on the consumer confidence index, regional Fed manufacturing data, and the results of US Treasury auctions. Better-than-expected data could lead to a moderate recovery in yields, supporting the dollar; however, new developments in geopolitical dynamics could cause oil price fluctuations, resulting in yield adjustments and potentially impacting the dollar due to risk aversion.
How does the correlation between the US dollar and US Treasury yields play out in the current environment?
The high-level fluctuations of the US dollar and the volatility of US Treasury yields are somewhat correlated, but both are essentially influenced by geopolitical risk pricing and policy space constraints. In the short term, range-bound trading is expected; if the US dollar breaks down effectively, it will provide support for gold and may push US Treasury yields further to test the lower end of the range. Overall, the market is characterized by price swings driven by data and geopolitical news.
Technical signals indicating that the US dollar index is fluctuating at high levels and under pressure
The US dollar index is currently at 99.1130, with a high of 99.5187 and a low of 97.6243 within the period. The previous high resistance level is at 99.0938. The Bollinger Bands (20,2) show an upper band of 99.4284, a middle band of 99.1490, and a lower band of 98.8695. The price is trading near the middle band, and the Bollinger Bands are narrowing, indicating that the previous upward momentum has significantly weakened and a sideways trading pattern has emerged.
The MACD (26,12,9) indicator shows the DIFF line crossing below the DEA line, forming a death cross, and the MACD histogram is gradually expanding, indicating increased short-term bearish momentum. In terms of candlestick patterns, the US dollar index, after rising from 97.6243 in early May, encountered resistance at 99.5187 and fell back, rebounding after testing the lower Bollinger Band. Currently, it is facing pressure near the middle Bollinger Band, and the bullish trend is showing signs of fatigue. Short-term support levels to watch are 98.8695 (lower Bollinger Band) and 98.9139, while resistance levels are 99.1490 (middle Bollinger Band) and 99.5187. Data shows that if the price continues to trade below the middle Bollinger Band, the probability of a weak and volatile market will gradually increase.
The correlation between US Treasury yield fluctuations and oil prices and geopolitical factors
In the US Treasury market, yields declined, with the 10-year Treasury yield exhibiting a two-way range of 4.60%-4.55% in the short term. Oil price volatility drove yield adjustments, and the market also remained focused on related diplomatic developments alongside recent military strikes. The UK 5-year and 30-year yield curve steepened slightly, with the 5-year yield triggering a double-top pattern, targeting a pullback to 4.12%, indicating that long-term interest rates in developed markets are facing overall adjustment pressure.
This trend is in tandem with the US dollar index: Amidst a high-level fluctuation in the dollar, adjustments in US Treasury yields reflect investors' dynamic pricing of geopolitical risks, while also highlighting the limited space for fiscal and monetary policy. Leading foreign media outlets point out that policymakers' ability to respond to shocks has diminished, and the impact of fiscal vulnerability on the sovereign debt market is gradually becoming apparent. In the short term, yield fluctuations will have some impact on the dollar, but geopolitical uncertainties will keep the trend cautious.
Cross-market verification of the negative correlation between gold and the US dollar
The latest spot gold price is 4509.57, with a high of 4773.37 (early May) and a low of 4453.60 (late May) within the same period. The Bollinger Bands (20,2) have an upper band of 4579.72, a middle band of 4536.25, and a lower band of 4492.78. The price is close to the lower band, indicating a short-term oversold condition. The Bollinger Bands are widening downwards, suggesting a short-term bearish trend. The MACD shows the DIFF line below the DEA line, with persistent green bars, indicating continued bearish momentum. However, the indicator is near its low, suggesting a potential rebound.
The candlestick pattern shows a post-decline consolidation pattern: after peaking in early May, it fell rapidly, rebounded slightly to around 4580 before encountering resistance, and then fell back to a second bottoming phase. Short-term support levels are 4492.78 (lower Bollinger Band) and 4453.60, while resistance levels are 4536.25 (middle Bollinger Band) and 4580. Data shows that gold and the US dollar index typically exhibit a negative correlation: if the dollar weakens, it will provide technical support for gold; conversely, if the dollar remains strong, gold will continue to face pressure. This negative correlation is currently being validated, becoming an important auxiliary indicator for observing the strength of the US dollar.
Fundamental factors constrain short-term fluctuations
Geopolitically, tensions in the Strait of Hormuz have hampered trade and aid, increased energy price volatility, and disrupted global supply chains. The coexistence of military action and diplomatic efforts makes risk premiums prone to fluctuations. On the economic data front, the upcoming consumer confidence index, house price index, and regional central bank manufacturing surveys will be key focuses. European Central Bank officials have emphasized that even with developments, a June rate hike is still necessary, indicating a divergence in policy paths among major economies.
On the supply side of US Treasury bonds, there are still a significant number of short-term and two-year notes up for auction this week. Coupled with fiscal spending pressures, the yield curve is likely to be influenced by the supply side. Overall, the fundamental factors constraining the US dollar and US Treasury yields are mainly reflected in the pricing of geopolitical risks and the interplay of policy expectations. A one-sided trend is unlikely in the short term, and range-bound trading is more probable.
Trend Outlook
Based on the above technical and fundamental analysis, the US dollar index is expected to continue fluctuating within the 98.87-99.43 range over the next 2-3 days. A break below the 99.1490 midline could test the 98.87-98.91 support zone; conversely, a hold above the midline would target resistance at 99.52. US Treasury yields are expected to maintain a two-way range, with the 10-year yield fluctuating around 4.55%-4.60%. Geopolitical developments and data releases will dominate short-term direction. Gold, as a correlated indicator, may seek a rebound within the 4493-4536 range if the dollar weakens. Overall, the market is expected to trade within a range in the short term, requiring close monitoring of the latest geopolitical developments, oil price fluctuations, and the impact of key economic data on cross-market correlations.
Frequently Asked Questions
Does the current death cross signal in the US dollar index indicate a reversal in the medium-term trend?
The current MACD death cross mainly reflects the strengthening of short-term bearish momentum, but the US dollar is still in a high-level consolidation phase within the upward trend that began in May. The narrowing Bollinger Bands indicate that the trend has shifted from a one-sided move to consolidation, rather than a clear medium-term reversal signal. It is necessary to observe whether the 98.87 support level is effectively broken. If it only fluctuates around the middle band, then the market will likely remain in a high-level consolidation phase.
What factors have driven the recent volatility in US Treasury yields?
Primarily influenced by oil price fluctuations and dynamic geopolitical events, the coexistence of military strikes and related diplomatic news led to divergent market interpretations. Fiscal vulnerability and limited policy space also constrained long-term yields, resulting in an overall range-bound trading pattern.
What implications do the oversold technical indicators of gold have for the US dollar's trajectory?
Gold is approaching the lower Bollinger Band and the MACD indicator is near a low level, suggesting a potential rebound. If gold achieves a corrective rebound, it often corresponds to a temporary weakening of the US dollar, confirming the negative correlation between the two. This signal can serve as a supplementary indicator for observing the short-term strength or weakness of the US dollar, but it needs to be judged in conjunction with the US dollar's own Bollinger Bands and MACD indicators.
What are the key risks in the next 2-3 days?
Key focus will be on the consumer confidence index, regional Fed manufacturing data, and the results of US Treasury auctions. Better-than-expected data could lead to a moderate recovery in yields, supporting the dollar; however, new developments in geopolitical dynamics could cause oil price fluctuations, resulting in yield adjustments and potentially impacting the dollar due to risk aversion.
How does the correlation between the US dollar and US Treasury yields play out in the current environment?
The high-level fluctuations of the US dollar and the volatility of US Treasury yields are somewhat correlated, but both are essentially influenced by geopolitical risk pricing and policy space constraints. In the short term, range-bound trading is expected; if the US dollar breaks down effectively, it will provide support for gold and may push US Treasury yields further to test the lower end of the range. Overall, the market is characterized by price swings driven by data and geopolitical news.
- Risk Warning and Disclaimer
- The market involves risk, and trading may not be suitable for all investors. This article is for reference only and does not constitute personal investment advice, nor does it take into account certain users’ specific investment objectives, financial situation, or other needs. Any investment decisions made based on this information are at your own risk.