The battle between dollar bulls and bears at the 99 level! Will it collapse? This time, the market is taking a huge gamble.
2026-05-26 21:22:38
On Tuesday, May 26, the US dollar index traded narrowly around 99 during the North American session. The 10-year US Treasury yield fell to about 4.50%, but the dollar did not weaken significantly in tandem. The core reason is that interest rate pricing, oil price inflation expectations, and geopolitical risk premiums are offsetting each other.

Typically, a decline in US Treasury yields would reduce the dollar's interest rate advantage, but the current market movement is not a one-dimensional one. After the Memorial Day holiday, the bond market resumed trading, and the subsequent yield decline reflected safe-haven buying and continued expectations of lower oil prices from the previous trading day. Meanwhile, the foreign exchange market is more focused on whether the Strait of Hormuz will reopen, the feasibility of negotiations regarding Iran, and whether energy prices will reignite inflation risks.
Therefore, the US dollar index is currently not simply trading on "lower yields," but rather on "whether lower yields are sufficient to cover the risk premium." If negotiations continue to show progress, safe-haven buying of the dollar may cool; however, as long as military friction, shipping risks, and energy inflation expectations persist, a linear downward pressure on the dollar is unlikely. Brent crude oil is still fluctuating around $99 per barrel, and West Texas Intermediate crude is around $92, indicating that energy variables have not yet been removed from foreign exchange pricing.
The U.S. Consumer Price Index (CPI) rose 3.8% year-on-year in April, up from 3.3% in March; the core index, excluding food and energy, rose 2.8% year-on-year. More importantly, the energy index rose 17.9% year-on-year, and gasoline rose 28.4% year-on-year, indicating that the market's sensitivity to oil price fluctuations is not merely emotional, but has been incorporated into the inflation data chain.
The Federal Reserve maintained its target range for the federal funds rate at 3.50% to 3.75% at its April meeting, and emphasized that it would continue to assess the balance of data, outlook, and risks. Meanwhile, the personal consumption expenditures price index rose 3.5% year-on-year in March, and the core personal consumption expenditures price index rose 3.2% year-on-year. The next April data will be released on May 28, making it difficult for the market to prematurely bet on a clear shift towards easing policy.
This is the macroeconomic source of the dollar's current resilience. Growth data is not strong enough to support the dollar alone, but inflationary pressures are not weak enough to allow interest rate expectations to be revised downwards rapidly. The 2.0% annualized real GDP growth in the first quarter only indicates that demand has not stalled, and cannot be simply interpreted as a reason for a stronger dollar.
News indicates that US-Iran negotiations are still progressing around a temporary framework, with the market focusing on a 60-day ceasefire agreement, the reopening of the Strait of Hormuz, and the possibility of sanctions easing. However, clear consensus has yet to be reached on issues such as the disposal of Iran's enriched uranium stockpile, international monitoring arrangements, and ceasefire conditions in Lebanon. The recent US so-called defensive strikes against targets in southern Iran, followed by a rebound in oil prices, suggest that investors are still pricing in the sustainability of the peace framework at a discount.
For traders, this means that the dollar index is not just looking at the negotiation titles, but also at the details of implementation, including the passage of Hormuz, tanker insurance rates, Iran's subsequent response, whether the attacks in the Lebanon direction have cooled down, and whether the Federal Reserve views the energy shock as a short-term disturbance.
From the 4-hour chart, the US dollar index is trading around 99.10, with the Bollinger Band middle band at approximately 99.1658, the upper band at approximately 99.4459, and the lower band at approximately 98.8857. The price is below the middle band but not far from the lower band, indicating short-term weakness and consolidation. The previous lows of 98.9139 and 98.8857 form the lower edge of the short-term price range, while the area around 99.16 is the mean reversion center. The 99.45 to 99.52 area represents the dense trading zone above the previous rebound.
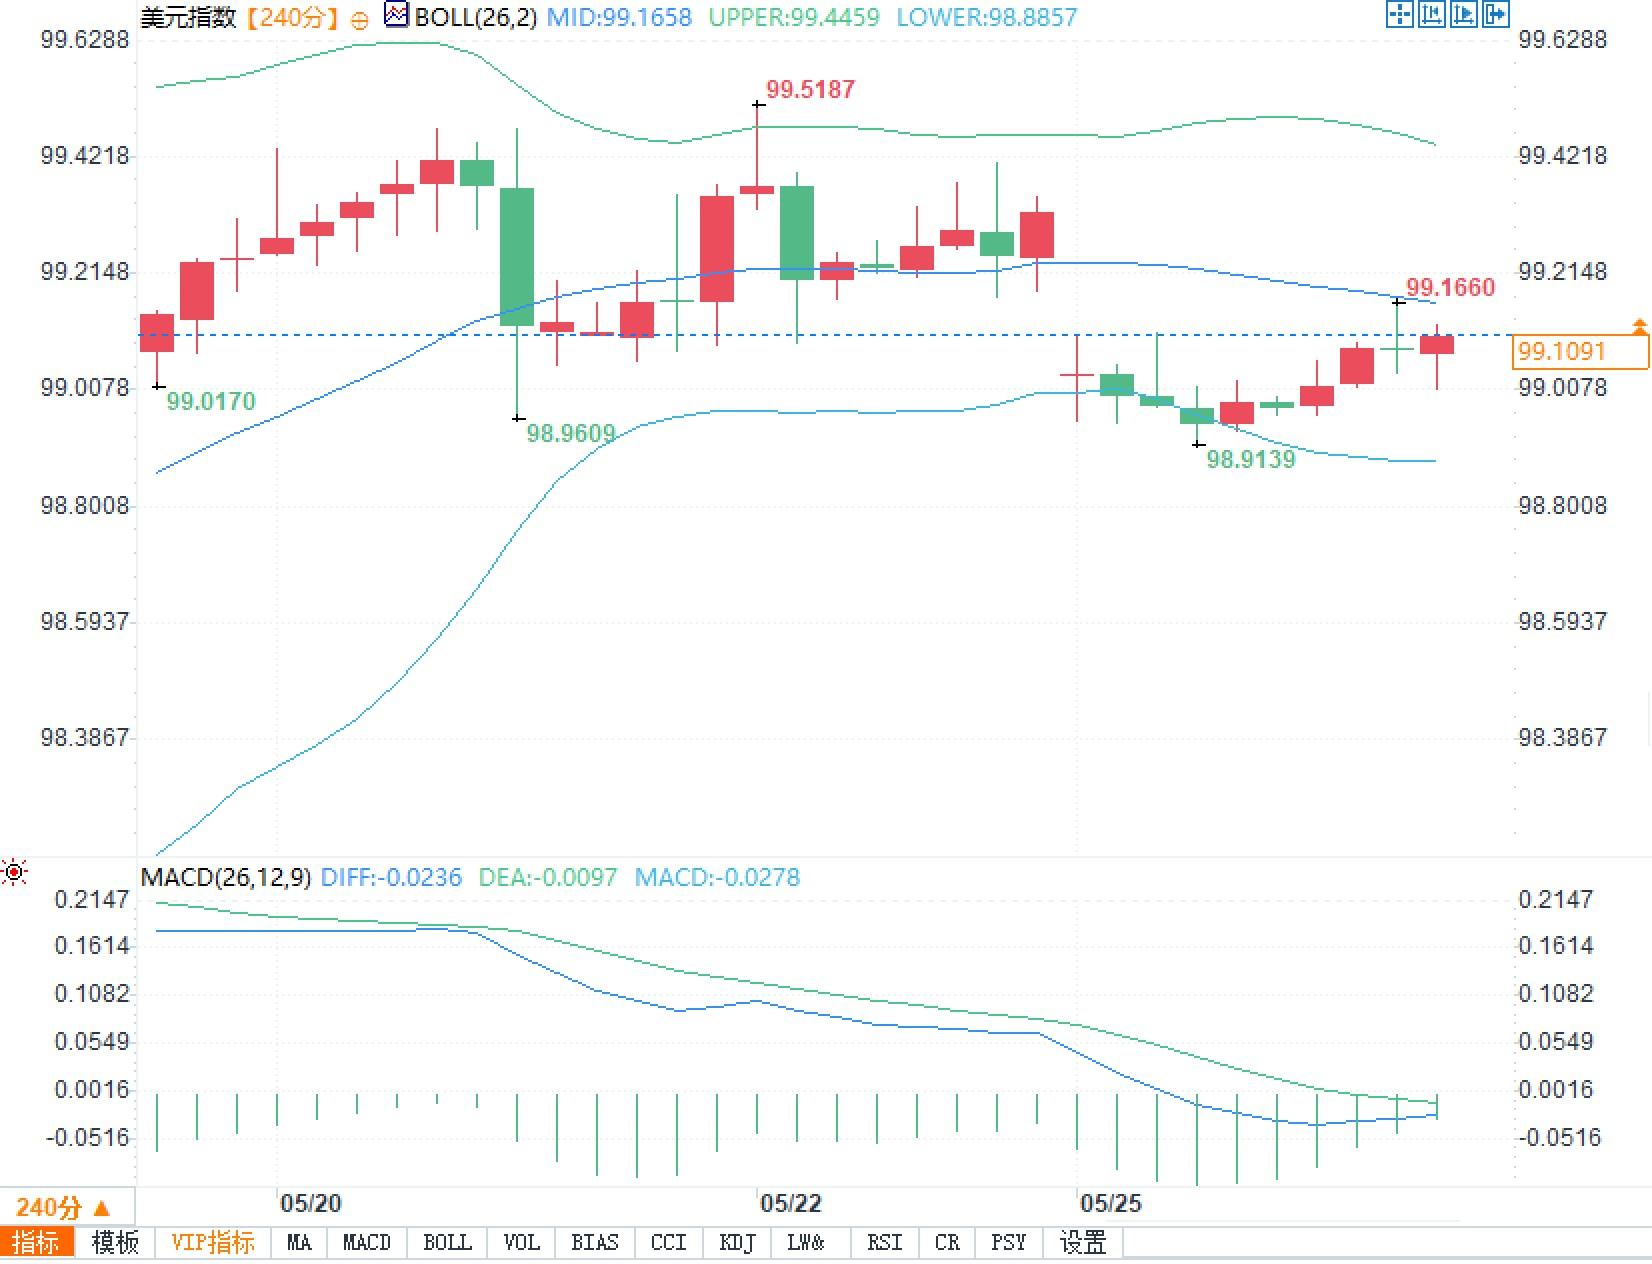
Momentum indicators are also cautious. The MACD DIFF is -0.0236, DEA is -0.0097, and the histogram is -0.0278, indicating that downward momentum remains, but the histogram has not expanded significantly, meaning that the bears' advantage comes more from trend inertia than from new shocks. If the US dollar index continues to trade sideways around the 99 level, the market is essentially waiting for two confirmation signals: whether oil prices continue to fall, and whether the Fed's policy expectations will be repriced following the inflation data on May 28th.
The US dollar did not follow the decline in US Treasury yields, indicating a divergence in pricing logic.
Typically, a decline in US Treasury yields would reduce the dollar's interest rate advantage, but the current market movement is not a one-dimensional one. After the Memorial Day holiday, the bond market resumed trading, and the subsequent yield decline reflected safe-haven buying and continued expectations of lower oil prices from the previous trading day. Meanwhile, the foreign exchange market is more focused on whether the Strait of Hormuz will reopen, the feasibility of negotiations regarding Iran, and whether energy prices will reignite inflation risks.
Therefore, the US dollar index is currently not simply trading on "lower yields," but rather on "whether lower yields are sufficient to cover the risk premium." If negotiations continue to show progress, safe-haven buying of the dollar may cool; however, as long as military friction, shipping risks, and energy inflation expectations persist, a linear downward pressure on the dollar is unlikely. Brent crude oil is still fluctuating around $99 per barrel, and West Texas Intermediate crude is around $92, indicating that energy variables have not yet been removed from foreign exchange pricing.
The fundamental contradiction lies in the fact that expectations of a decline in inflation are repeatedly interrupted by energy risks.
The U.S. Consumer Price Index (CPI) rose 3.8% year-on-year in April, up from 3.3% in March; the core index, excluding food and energy, rose 2.8% year-on-year. More importantly, the energy index rose 17.9% year-on-year, and gasoline rose 28.4% year-on-year, indicating that the market's sensitivity to oil price fluctuations is not merely emotional, but has been incorporated into the inflation data chain.
The Federal Reserve maintained its target range for the federal funds rate at 3.50% to 3.75% at its April meeting, and emphasized that it would continue to assess the balance of data, outlook, and risks. Meanwhile, the personal consumption expenditures price index rose 3.5% year-on-year in March, and the core personal consumption expenditures price index rose 3.2% year-on-year. The next April data will be released on May 28, making it difficult for the market to prematurely bet on a clear shift towards easing policy.
This is the macroeconomic source of the dollar's current resilience. Growth data is not strong enough to support the dollar alone, but inflationary pressures are not weak enough to allow interest rate expectations to be revised downwards rapidly. The 2.0% annualized real GDP growth in the first quarter only indicates that demand has not stalled, and cannot be simply interpreted as a reason for a stronger dollar.
The Hormuz variable determines the risk premium, and credible progress in negotiations still lacks concrete results.
News indicates that US-Iran negotiations are still progressing around a temporary framework, with the market focusing on a 60-day ceasefire agreement, the reopening of the Strait of Hormuz, and the possibility of sanctions easing. However, clear consensus has yet to be reached on issues such as the disposal of Iran's enriched uranium stockpile, international monitoring arrangements, and ceasefire conditions in Lebanon. The recent US so-called defensive strikes against targets in southern Iran, followed by a rebound in oil prices, suggest that investors are still pricing in the sustainability of the peace framework at a discount.
For traders, this means that the dollar index is not just looking at the negotiation titles, but also at the details of implementation, including the passage of Hormuz, tanker insurance rates, Iran's subsequent response, whether the attacks in the Lebanon direction have cooled down, and whether the Federal Reserve views the energy shock as a short-term disturbance.
Technical analysis shows the US dollar index is in a rebalancing zone around the 99 level.
From the 4-hour chart, the US dollar index is trading around 99.10, with the Bollinger Band middle band at approximately 99.1658, the upper band at approximately 99.4459, and the lower band at approximately 98.8857. The price is below the middle band but not far from the lower band, indicating short-term weakness and consolidation. The previous lows of 98.9139 and 98.8857 form the lower edge of the short-term price range, while the area around 99.16 is the mean reversion center. The 99.45 to 99.52 area represents the dense trading zone above the previous rebound.
Momentum indicators are also cautious. The MACD DIFF is -0.0236, DEA is -0.0097, and the histogram is -0.0278, indicating that downward momentum remains, but the histogram has not expanded significantly, meaning that the bears' advantage comes more from trend inertia than from new shocks. If the US dollar index continues to trade sideways around the 99 level, the market is essentially waiting for two confirmation signals: whether oil prices continue to fall, and whether the Fed's policy expectations will be repriced following the inflation data on May 28th.
- Risk Warning and Disclaimer
- The market involves risk, and trading may not be suitable for all investors. This article is for reference only and does not constitute personal investment advice, nor does it take into account certain users’ specific investment objectives, financial situation, or other needs. Any investment decisions made based on this information are at your own risk.