US Treasury yields plummeted first, but gold didn't follow suit? This kind of misalignment is most likely to lead to a large one-sided market movement!
2026-05-27 19:04:36
Wednesday (May 27) Market Overview: Spot gold continues its medium-term downward channel, with the latest price on the 240-minute chart dropping to around $4443.31 per ounce, breaking below the previous support level of $4453.60, indicating strong short-term bearish momentum. Meanwhile, the 2-year US Treasury yield has fallen rapidly from its high of 4.26% on May 27 to around 4.02%, retracing recent gains and testing the 4.00% support level. Data shows that the negative correlation between the two remains intact: as yields rose and fell, gold's decline slowed. Reports from major overseas institutions indicate that the relatively high US Treasury yields are putting pressure on risk assets such as stocks, while Federal Reserve officials have emphasized that inflation risks outweigh the risks of a deteriorating labor market, and the inflationary shockwaves from the Middle East situation may continue to impact the bond market. In the short term, policy expectations, interest rate paths, and technical signals will jointly shape the market's direction.

The 240-minute chart for spot gold shows a sustained decline from the mid-May high of $4773.37/oz, with the price recently breaking below the $4453.60 support level and trading near a low of $4443.31. The Bollinger Bands indicator shows that after breaking below the lower band at $4459.78, the price continues to move downwards along the lower band, without a clear bottoming pattern, indicating a short-term oversold condition but with remaining momentum. On the MACD side, the DIFF value of -16.35 is lower than the DEA value of -8.97, and the histogram remains negative and diverging downwards, with no bullish divergence signal appearing during the release of bearish momentum.
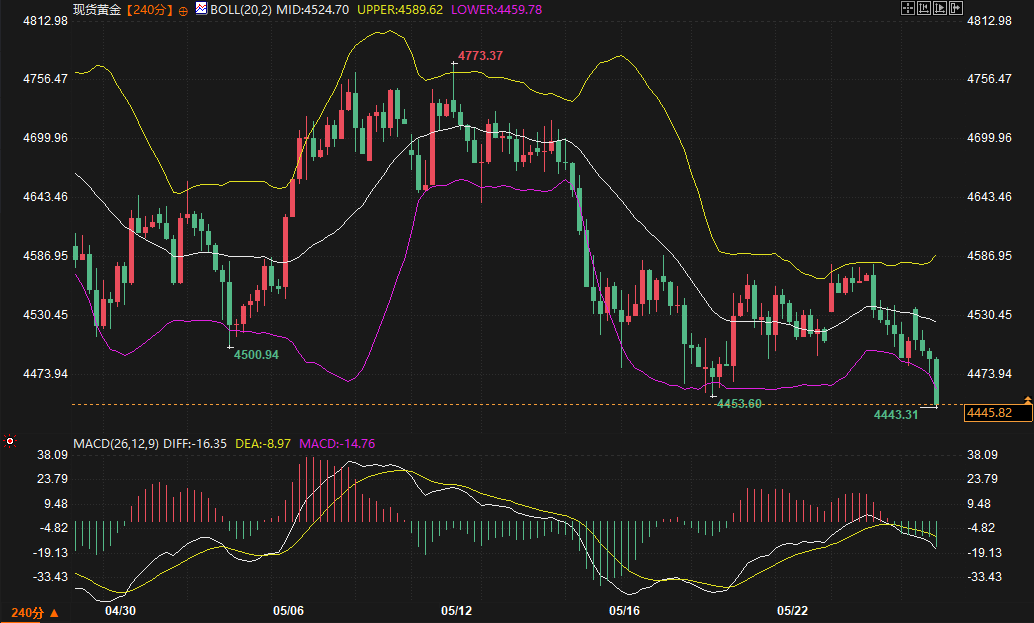
Regarding support and resistance levels , the key short-term resistance level to watch is the Bollinger Band middle line at 4524.70, while support is currently seen around the previous low of 4450. A break below 4450 could open up further downside potential. Data suggests that current technical signals are cautious, and a clear stabilization pattern is needed.
The 2-year US Treasury yield on the 240-minute chart shows a pattern of rising and then falling back. After reaching a high of 4.26% on May 27, it quickly plunged back to around 4.02%, testing the psychological level of 4.00% and the lower Bollinger Band support. The Bollinger Bands show that after previously rising to the upper band, it fell back below the middle band at 4.081 and is approaching the lower band at 4.004, indicating a shift from short-term strength to a correction. In the MACD indicator, the DIFF has just crossed below the DEA, and the histogram has turned from positive to negative, indicating waning bullish momentum and initial bearish signals.
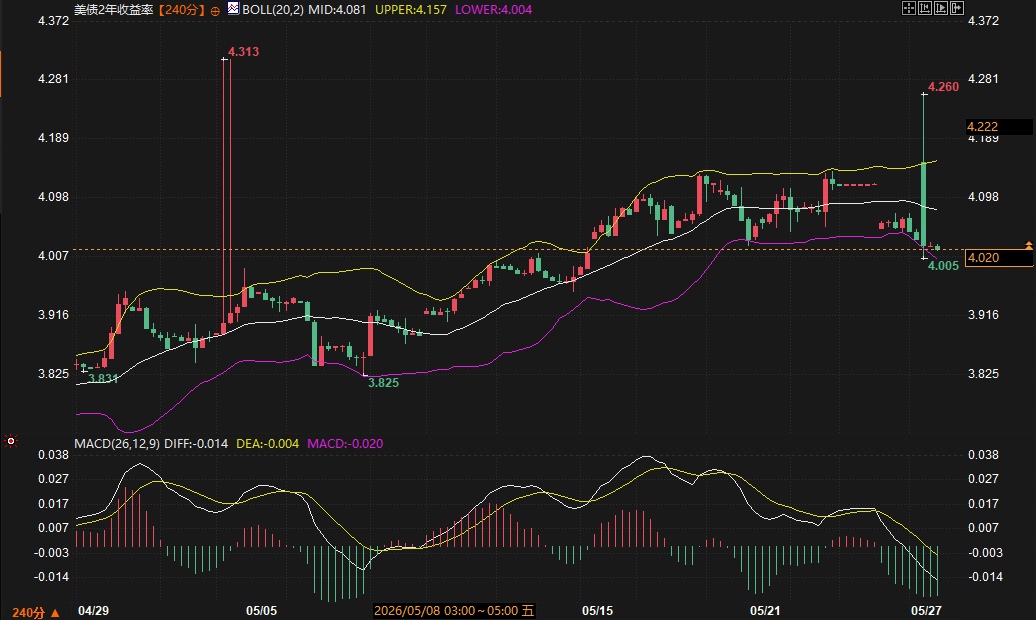
In terms of support and resistance levels , short-term support lies at the 4.00% Fibonacci retracement level and the lower Bollinger Band, while resistance is seen at the middle Bollinger Band at 4.08% and the previous high of 4.26%. A well-known foreign media analysis suggests that with US Treasury yields near the critical level of 4.5%, the relative attractiveness of equity assets to these yields warrants attention. The current pullback in the 2-year yield reflects a phased adjustment in the market's assessment of the interest rate path.
As a non-interest-bearing asset, gold typically maintains a strong negative correlation with the 2-year US Treasury yield, which reflects short-term interest rate expectations: rising yields increase the opportunity cost of holding gold, thus weighing on gold prices; falling yields alleviate this pressure. From mid-May to May 26th, the 2-year yield climbed from around 3.9% to 4.26%, while gold prices fell from a high of $4773 to around $4500 during the same period. The rising yields were a significant driver of downward pressure on gold prices. On May 27th, the yield fell rapidly by nearly 20 basis points, and the decline in gold prices also slowed, consistent with this correlation.
If the 2-year yield breaks below the 4.00% support level, gold is likely to see a corrective rebound; conversely, if the yield resumes its upward trend and breaks through 4.1%, downward pressure on gold may continue. A potential divergence risk should be noted: if yields fall but gold continues to weaken, it may reflect that other fundamental factors are temporarily dominating the market.
Reports from major overseas institutions indicate that inflation risks in the United States continue to be a concern. Minneapolis Federal Reserve President Neel Kashkari pointed out that inflation risks currently outweigh the risks of a deteriorating labor market, and data since April has not shown a decline in inflation. The inflationary shockwaves from the Middle East situation may persist and have already impacted the bond market. Federal Reserve officials are cautious about betting on an October rate hike, believing it is still too early to determine the timing of the next interest rate move.
This fundamental environment and technical factors corroborate each other: higher yield ranges limit asset valuation space, while rising inflation expectations support yield floor. As a safe-haven asset, gold's price movement must simultaneously weigh the opportunity cost of interest rates and potential safe-haven demand; in the short term, the equilibrium point between these two factors determines the characteristics of its price range.
Trend Outlook: Over the next 2-3 days, the 2-year US Treasury yield is likely to fluctuate within the 4.00%-4.08% range. If it holds above 4.00%, the downward pressure will be limited. Gold remains under pressure below 4524.70 in the short term; watch the effectiveness of support around 4450. The logic suggests that if yields remain low, gold may attempt a correction, but the medium-term downtrend remains unchanged, and further confirmation of a directional shift is needed. The overall market remains constrained by inflation trends and geopolitical factors, and a cautious, volatile pattern is expected.
After gold broke below the support level of 4453.60, has it entered oversold territory in the short term?
From a technical perspective, the price broke below the lower Bollinger Band on the 240-minute chart and has been trading along it. The MACD indicator shows continued bearish momentum, indicating a short-term oversold condition, but a clear bottoming signal is yet to be seen. It's necessary to observe whether the price can stabilize around 4450. If the rebound is weak, further downside potential remains.
What is the significance of the 2-year US Treasury yield testing the 4.00% support level?
The 4.00% level is a key psychological level and the lower Bollinger Band. Holding this level could alleviate recent downward pressure; however, a breach could lead to further declines in yields, potentially easing pressure on gold. Currently, the MACD is showing initial bearish signals, suggesting short-term consolidation.
Is the negative correlation between gold and 2-year yields reliable at present?
Recent price movements perfectly align with this logic: a surge in yields corresponds to a pullback in gold, while a drop in yields corresponds to a slowdown in the decline of gold. However, a divergence should be noted. If yields fall while gold remains weak, other factors such as inflation expectations or the dynamics of the US dollar may temporarily take precedence.
What potential impact will the latest statements from Federal Reserve officials have on US Treasury yields?
Kashkari emphasized that inflation risks are high and the impact of the Middle East situation may continue, and the market's digestion of expectations for further tightening will support the yield floor. However, he believes it is too early to judge the timing of the next action, and short-term policy uncertainty may maintain yield range-bound trading.
What are the key points to watch for in the next 2-3 days regarding the trends of gold and US Treasury yields?
Key focus should be on whether the 2-year yield can hold above 4.00% and the effectiveness of the support level for gold at 4450, while also monitoring inflation-related data and geopolitical news. If the yield stabilizes within the 4.00%-4.08% range, gold may attempt a recovery in the 4440-4520 range; a breakout or breakdown of key levels would open up new upside potential.
Gold's technical oversold condition and short-term pressure
The 240-minute chart for spot gold shows a sustained decline from the mid-May high of $4773.37/oz, with the price recently breaking below the $4453.60 support level and trading near a low of $4443.31. The Bollinger Bands indicator shows that after breaking below the lower band at $4459.78, the price continues to move downwards along the lower band, without a clear bottoming pattern, indicating a short-term oversold condition but with remaining momentum. On the MACD side, the DIFF value of -16.35 is lower than the DEA value of -8.97, and the histogram remains negative and diverging downwards, with no bullish divergence signal appearing during the release of bearish momentum.
Regarding support and resistance levels , the key short-term resistance level to watch is the Bollinger Band middle line at 4524.70, while support is currently seen around the previous low of 4450. A break below 4450 could open up further downside potential. Data suggests that current technical signals are cautious, and a clear stabilization pattern is needed.
2-year US Treasury yield pullback and interest rate expectations
The 2-year US Treasury yield on the 240-minute chart shows a pattern of rising and then falling back. After reaching a high of 4.26% on May 27, it quickly plunged back to around 4.02%, testing the psychological level of 4.00% and the lower Bollinger Band support. The Bollinger Bands show that after previously rising to the upper band, it fell back below the middle band at 4.081 and is approaching the lower band at 4.004, indicating a shift from short-term strength to a correction. In the MACD indicator, the DIFF has just crossed below the DEA, and the histogram has turned from positive to negative, indicating waning bullish momentum and initial bearish signals.
In terms of support and resistance levels , short-term support lies at the 4.00% Fibonacci retracement level and the lower Bollinger Band, while resistance is seen at the middle Bollinger Band at 4.08% and the previous high of 4.26%. A well-known foreign media analysis suggests that with US Treasury yields near the critical level of 4.5%, the relative attractiveness of equity assets to these yields warrants attention. The current pullback in the 2-year yield reflects a phased adjustment in the market's assessment of the interest rate path.
The negative correlation between gold and US Treasury yields
As a non-interest-bearing asset, gold typically maintains a strong negative correlation with the 2-year US Treasury yield, which reflects short-term interest rate expectations: rising yields increase the opportunity cost of holding gold, thus weighing on gold prices; falling yields alleviate this pressure. From mid-May to May 26th, the 2-year yield climbed from around 3.9% to 4.26%, while gold prices fell from a high of $4773 to around $4500 during the same period. The rising yields were a significant driver of downward pressure on gold prices. On May 27th, the yield fell rapidly by nearly 20 basis points, and the decline in gold prices also slowed, consistent with this correlation.
If the 2-year yield breaks below the 4.00% support level, gold is likely to see a corrective rebound; conversely, if the yield resumes its upward trend and breaks through 4.1%, downward pressure on gold may continue. A potential divergence risk should be noted: if yields fall but gold continues to weaken, it may reflect that other fundamental factors are temporarily dominating the market.
Fundamental inflation concerns merge with policy signals
Reports from major overseas institutions indicate that inflation risks in the United States continue to be a concern. Minneapolis Federal Reserve President Neel Kashkari pointed out that inflation risks currently outweigh the risks of a deteriorating labor market, and data since April has not shown a decline in inflation. The inflationary shockwaves from the Middle East situation may persist and have already impacted the bond market. Federal Reserve officials are cautious about betting on an October rate hike, believing it is still too early to determine the timing of the next interest rate move.
This fundamental environment and technical factors corroborate each other: higher yield ranges limit asset valuation space, while rising inflation expectations support yield floor. As a safe-haven asset, gold's price movement must simultaneously weigh the opportunity cost of interest rates and potential safe-haven demand; in the short term, the equilibrium point between these two factors determines the characteristics of its price range.
Trend Outlook: Over the next 2-3 days, the 2-year US Treasury yield is likely to fluctuate within the 4.00%-4.08% range. If it holds above 4.00%, the downward pressure will be limited. Gold remains under pressure below 4524.70 in the short term; watch the effectiveness of support around 4450. The logic suggests that if yields remain low, gold may attempt a correction, but the medium-term downtrend remains unchanged, and further confirmation of a directional shift is needed. The overall market remains constrained by inflation trends and geopolitical factors, and a cautious, volatile pattern is expected.
Frequently Asked Questions
After gold broke below the support level of 4453.60, has it entered oversold territory in the short term?
From a technical perspective, the price broke below the lower Bollinger Band on the 240-minute chart and has been trading along it. The MACD indicator shows continued bearish momentum, indicating a short-term oversold condition, but a clear bottoming signal is yet to be seen. It's necessary to observe whether the price can stabilize around 4450. If the rebound is weak, further downside potential remains.
What is the significance of the 2-year US Treasury yield testing the 4.00% support level?
The 4.00% level is a key psychological level and the lower Bollinger Band. Holding this level could alleviate recent downward pressure; however, a breach could lead to further declines in yields, potentially easing pressure on gold. Currently, the MACD is showing initial bearish signals, suggesting short-term consolidation.
Is the negative correlation between gold and 2-year yields reliable at present?
Recent price movements perfectly align with this logic: a surge in yields corresponds to a pullback in gold, while a drop in yields corresponds to a slowdown in the decline of gold. However, a divergence should be noted. If yields fall while gold remains weak, other factors such as inflation expectations or the dynamics of the US dollar may temporarily take precedence.
What potential impact will the latest statements from Federal Reserve officials have on US Treasury yields?
Kashkari emphasized that inflation risks are high and the impact of the Middle East situation may continue, and the market's digestion of expectations for further tightening will support the yield floor. However, he believes it is too early to judge the timing of the next action, and short-term policy uncertainty may maintain yield range-bound trading.
What are the key points to watch for in the next 2-3 days regarding the trends of gold and US Treasury yields?
Key focus should be on whether the 2-year yield can hold above 4.00% and the effectiveness of the support level for gold at 4450, while also monitoring inflation-related data and geopolitical news. If the yield stabilizes within the 4.00%-4.08% range, gold may attempt a recovery in the 4440-4520 range; a breakout or breakdown of key levels would open up new upside potential.
- Risk Warning and Disclaimer
- The market involves risk, and trading may not be suitable for all investors. This article is for reference only and does not constitute personal investment advice, nor does it take into account certain users’ specific investment objectives, financial situation, or other needs. Any investment decisions made based on this information are at your own risk.