Crude oil prices have seemingly fallen to $94, but options are secretly betting that it could return to triple digits at any time.
2026-05-27 19:47:04
On Wednesday, May 27th, the main theme in the crude oil market shifted from simple supply shocks to the repricing of diplomatic expectations, shipping constraints, and refined product risks. Brent crude futures were currently around $94 per barrel, with an intraday range of approximately $92.85 to $96.50 per barrel; West Texas Intermediate crude was around $90.50 per barrel, indicating that the market remains in a high-frequency revaluation state driven by news.

The immediate trigger for this round of oil price decline was the market repricing as negotiations between Washington and Tehran continued. US Secretary of State Rubio recently stated that arrangements might still take several days to finalize, prompting traders to lower their assumptions regarding the most extreme supply disruptions. The market reaction was not due to a bearish outlook on fundamentals, but rather because the geopolitical risk premium previously embedded in prices was partially squeezed out.
However, this cooling down does not equate to a normalization. Option pricing still indicates a relatively high probability that oil prices will climb back above $100 per barrel in the next three months. For traders, the key is not the individual news item itself, but whether the negotiations can translate into verifiable shipping recovery, lower insurance rates, and improved spot loading schedules. If there is only verbal easing without logistical confirmation, the downside potential for oil prices is likely to be limited.
The Strait of Hormuz is not an ordinary shipping route, but a risk valve for global energy assets. Official energy data has shown that from 2024 to the first quarter of 2025, the flow of crude oil, condensate, and refined oil products through the strait accounted for more than 25% of global seaborne oil trade and about 20% of global oil and petroleum product consumption; at the same time, about 20% of global liquefied natural gas trade also passes through this channel.
This means that oil prices are currently not simply trading on inventory, but rather on shipping availability. As long as uncertainty remains regarding passage, insurance, escort, and port queues, near-month contracts are unlikely to fully revert to traditional supply and demand models. Even if some vessels resume passage, the market still needs to confirm that this recovery is continuous, rather than a one-off easing. Once shipping traffic is disrupted again, risk premiums could be quickly recovered.
The demand side is not ignoring high oil prices. The latest monthly energy assessment in May shows that global oil demand is expected to decrease by 420,000 barrels per day year-on-year in 2026, falling to about 104 million barrels per day; the decline is more pronounced in the second quarter, with an estimated year-on-year decrease of 2.45 million barrels per day. Aviation, petrochemical and end-use fuel consumption are all affected by high prices and demand-saving behavior.
There are also structural disturbances on the supply side. According to the latest weekly data from the U.S., refinery inputs were approximately 16.3 million barrels per day, with an operating rate of 91.6%, gasoline production was approximately 9.3 million barrels per day, and distillate fuel production was approximately 5 million barrels per day; during the same period, commercial crude oil inventories decreased by 7.86 million barrels, indicating that the refining sector is still maintaining a high throughput, which is supporting the spot price of crude oil.
From a daily chart perspective, Brent crude oil is priced at around $94 per barrel, which is below the lower Bollinger Band at $95.81 per barrel; the middle Bollinger Band is at $105.36 per barrel, and the upper Bollinger Band is at $114.91 per barrel. After falling from the previous high of $115.21 per barrel, the recent low touched $92.86 per barrel, indicating that short-term fluctuations have shifted from high-level consolidation to widening beyond the lower Bollinger Band.
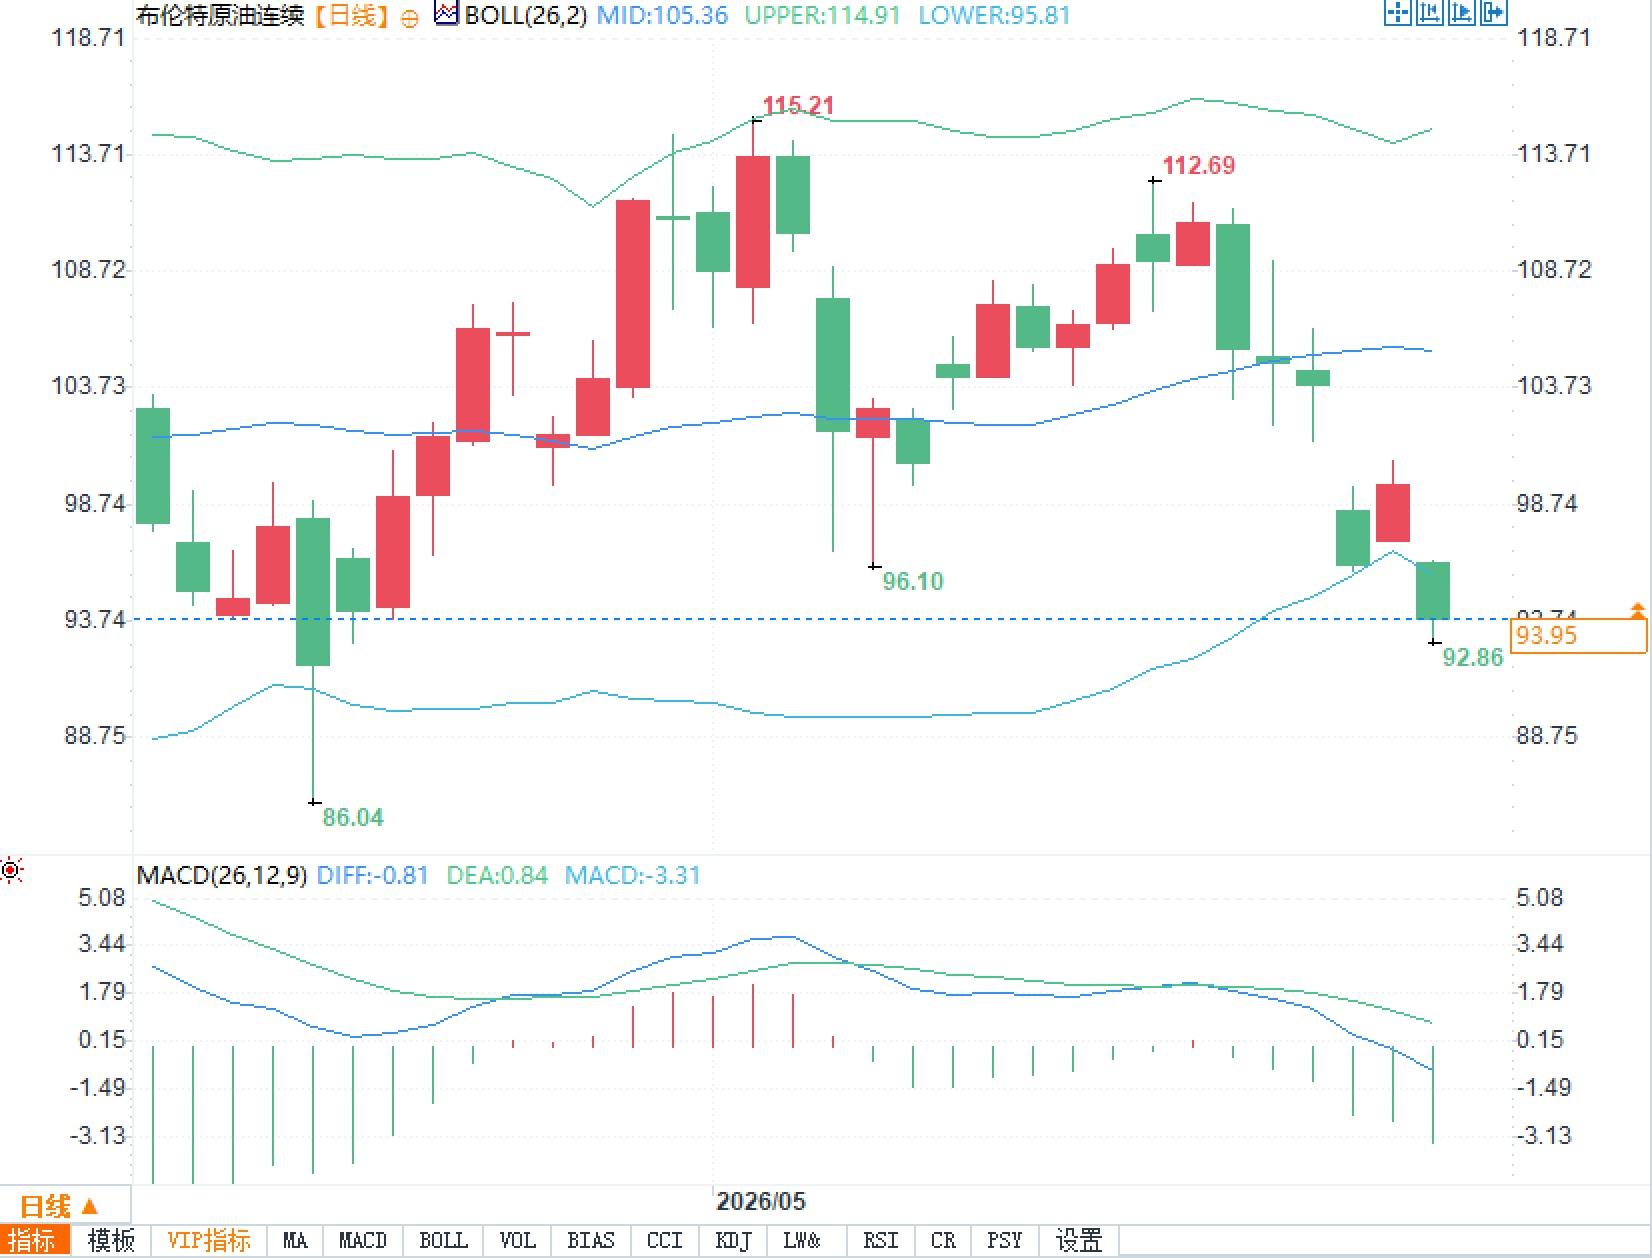
The MACD indicator also weakened, with the DIFF at -0.81, DEA at 0.84, and the histogram at -3.31, reflecting continued bearish momentum. More importantly, the price breaking below the lower band does not automatically indicate a smooth downward trend; rather, it suggests that event pricing has entered a high-volatility zone. Currently, the market reacts more quickly to positive news and is more sensitive to supply disruptions. In other words, the technical signals are not directional conclusions, but rather volatility warnings.
Question 1: Why did oil prices fall when supply remained tight?
A: The decline mainly stemmed from rising diplomatic expectations, with the market preemptively eliminating some of the premiums from extreme supply disruptions. However, inventory, shipping, and insurance costs have not yet fully recovered, so the fundamentals have not weakened across the board.
Question 2: Does the resumption of passage through Hormuz mean that oil price pressure has been relieved?
A: Not entirely. The market needs to observe whether continuous passage, loading rhythm, insurance rates, and port congestion improve in tandem; a single vessel passage can only indicate localized easing.
Question 3: What does it mean if the price breaks below the lower Bollinger Band from a technical perspective?
A: This indicates that prices have entered a high volatility phase and short-term sentiment is weak. However, during periods of intense news, technical signals are easily rewritten by diplomatic and shipping news.
Diplomatic premiums have eased, but risks have not been eliminated.
The immediate trigger for this round of oil price decline was the market repricing as negotiations between Washington and Tehran continued. US Secretary of State Rubio recently stated that arrangements might still take several days to finalize, prompting traders to lower their assumptions regarding the most extreme supply disruptions. The market reaction was not due to a bearish outlook on fundamentals, but rather because the geopolitical risk premium previously embedded in prices was partially squeezed out.
However, this cooling down does not equate to a normalization. Option pricing still indicates a relatively high probability that oil prices will climb back above $100 per barrel in the next three months. For traders, the key is not the individual news item itself, but whether the negotiations can translate into verifiable shipping recovery, lower insurance rates, and improved spot loading schedules. If there is only verbal easing without logistical confirmation, the downside potential for oil prices is likely to be limited.
The Hormuz remains a risk valve for crude oil pricing.
The Strait of Hormuz is not an ordinary shipping route, but a risk valve for global energy assets. Official energy data has shown that from 2024 to the first quarter of 2025, the flow of crude oil, condensate, and refined oil products through the strait accounted for more than 25% of global seaborne oil trade and about 20% of global oil and petroleum product consumption; at the same time, about 20% of global liquefied natural gas trade also passes through this channel.
This means that oil prices are currently not simply trading on inventory, but rather on shipping availability. As long as uncertainty remains regarding passage, insurance, escort, and port queues, near-month contracts are unlikely to fully revert to traditional supply and demand models. Even if some vessels resume passage, the market still needs to confirm that this recovery is continuous, rather than a one-off easing. Once shipping traffic is disrupted again, risk premiums could be quickly recovered.
A two-way squeeze is forming between supply and demand.
The demand side is not ignoring high oil prices. The latest monthly energy assessment in May shows that global oil demand is expected to decrease by 420,000 barrels per day year-on-year in 2026, falling to about 104 million barrels per day; the decline is more pronounced in the second quarter, with an estimated year-on-year decrease of 2.45 million barrels per day. Aviation, petrochemical and end-use fuel consumption are all affected by high prices and demand-saving behavior.
There are also structural disturbances on the supply side. According to the latest weekly data from the U.S., refinery inputs were approximately 16.3 million barrels per day, with an operating rate of 91.6%, gasoline production was approximately 9.3 million barrels per day, and distillate fuel production was approximately 5 million barrels per day; during the same period, commercial crude oil inventories decreased by 7.86 million barrels, indicating that the refining sector is still maintaining a high throughput, which is supporting the spot price of crude oil.
Technical analysis indicates that prices have entered a phase of widening from the lower Bollinger Band.
From a daily chart perspective, Brent crude oil is priced at around $94 per barrel, which is below the lower Bollinger Band at $95.81 per barrel; the middle Bollinger Band is at $105.36 per barrel, and the upper Bollinger Band is at $114.91 per barrel. After falling from the previous high of $115.21 per barrel, the recent low touched $92.86 per barrel, indicating that short-term fluctuations have shifted from high-level consolidation to widening beyond the lower Bollinger Band.
The MACD indicator also weakened, with the DIFF at -0.81, DEA at 0.84, and the histogram at -3.31, reflecting continued bearish momentum. More importantly, the price breaking below the lower band does not automatically indicate a smooth downward trend; rather, it suggests that event pricing has entered a high-volatility zone. Currently, the market reacts more quickly to positive news and is more sensitive to supply disruptions. In other words, the technical signals are not directional conclusions, but rather volatility warnings.
Frequently Asked Questions
Question 1: Why did oil prices fall when supply remained tight?
A: The decline mainly stemmed from rising diplomatic expectations, with the market preemptively eliminating some of the premiums from extreme supply disruptions. However, inventory, shipping, and insurance costs have not yet fully recovered, so the fundamentals have not weakened across the board.
Question 2: Does the resumption of passage through Hormuz mean that oil price pressure has been relieved?
A: Not entirely. The market needs to observe whether continuous passage, loading rhythm, insurance rates, and port congestion improve in tandem; a single vessel passage can only indicate localized easing.
Question 3: What does it mean if the price breaks below the lower Bollinger Band from a technical perspective?
A: This indicates that prices have entered a high volatility phase and short-term sentiment is weak. However, during periods of intense news, technical signals are easily rewritten by diplomatic and shipping news.
- Risk Warning and Disclaimer
- The market involves risk, and trading may not be suitable for all investors. This article is for reference only and does not constitute personal investment advice, nor does it take into account certain users’ specific investment objectives, financial situation, or other needs. Any investment decisions made based on this information are at your own risk.