US Treasury bond volatility, strengthening dollar, and gold breaking through key levels: In-depth analysis of the current market's core themes.
2026-05-28 19:55:50
On Thursday (May 28), global financial markets experienced significant volatility driven by geopolitical events and inflation expectations. US Treasury yields fluctuated widely around the 4.5% mark, the US dollar index surged to a one-week high, and spot gold fell below $4,400, hitting a more than two-month low. The upcoming release of the US core PCE price index later in the evening will be a key variable influencing market movements over the next 2-3 days, with cross-asset correlations significantly strengthened.
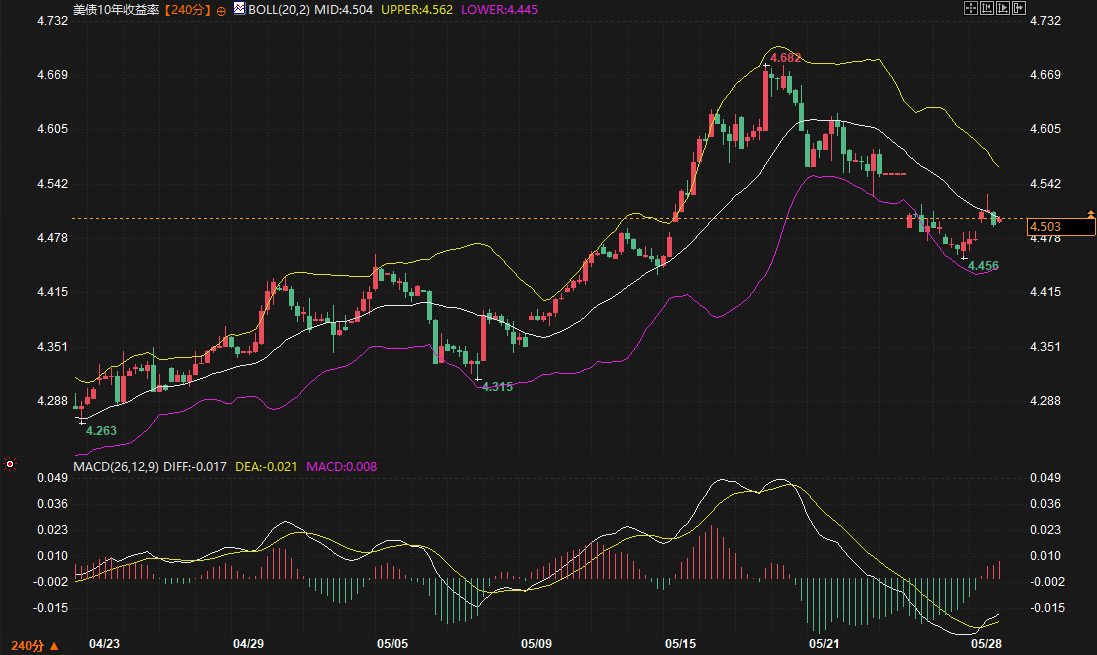
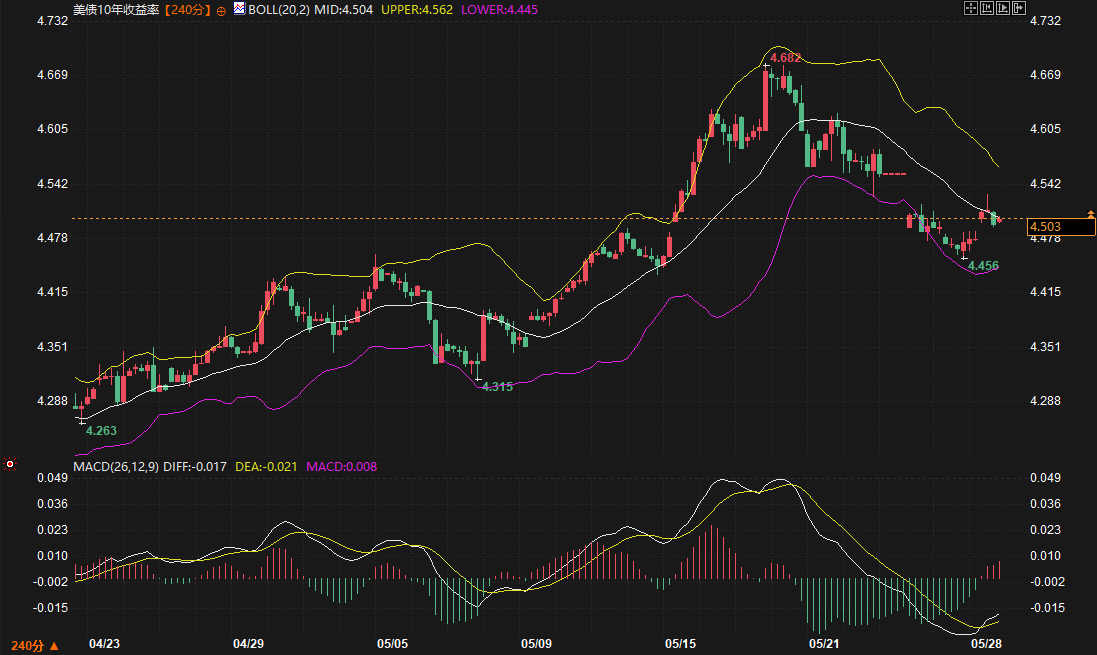
Data shows that the 10-year US Treasury yield is currently at 4.503%, with the 240-minute Bollinger Bands showing the middle band at 4.504%, the upper band at 4.562%, and the lower band at 4.445%. The MACD indicator shows a slight expansion of the red bars, indicating a short-term balance between bullish and bearish forces. From a fundamental perspective, the rise in oil prices triggered by the Russia-Ukraine conflict has pushed up inflation expectations. Major overseas institutions predict that if the upcoming core PCE year-on-year growth rate rises to 3.3%, it will further reinforce the Federal Reserve's "higher and longer" interest rate stance, and the 10-year yield is expected to fill the previous gap of 4.52%-4.554%. If the data exceeds expectations and reaches a month-on-month growth rate of 0.4%, the yield may rise above 4.60%.
From a technical perspective, the 10-year Treasury yield, after breaking through the Bollinger Band's narrowing range from 4.22% to 4.682%, has now retraced to confirm the middle band, with the 4.43%-4.47% range providing strong support. The 2-year Treasury yield is currently at 4.061%, with the Bollinger Band middle band at 4.062% almost coinciding with the current price, indicating a short-term trading range of 4.00%-4.13%. Logically, the current tactical trading strategy in the US Treasury market is primarily range-bound, with 4.48%-4.53% being the core trading range for the 10-year yield over the next 2-3 days. An upward breakout requires a clear catalyst from inflation data.
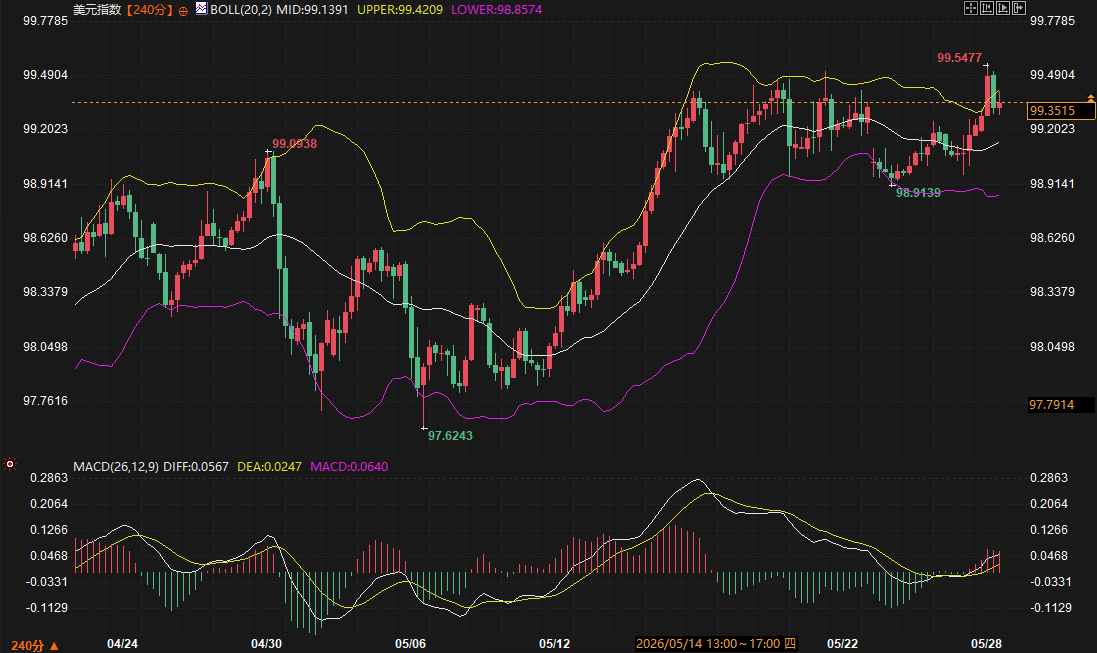
The US dollar index is currently at 99.3515. On the 240-minute chart, the upper Bollinger Band is at 99.4209, and the lower band is at 98.8574. The MACD indicator shows a continued expansion of the red bars, indicating that short-term upward momentum remains. From a fundamental perspective, safe-haven inflows amid escalating geopolitical conflicts, coupled with rising inflation expectations delaying the timing of the Federal Reserve's interest rate cuts, have jointly supported the strengthening of the US dollar index. It has now broken through the upper limit of its previous trading range, reaching a one-week high of 99.5477.
From a technical perspective, the US dollar index has stabilized above the key resistance level of 99.20, with support levels in the 98.90-99.00 range. If inflation data exceeds expectations, it could potentially rise further to the 99.60-99.70 range. Logically, the current strength of the US dollar is supported by both safe-haven appeal and policy expectations. If core PCE data does not significantly fall short of expectations in the next 2-3 days, the US dollar index is likely to maintain a slightly bullish trend with limited downside.
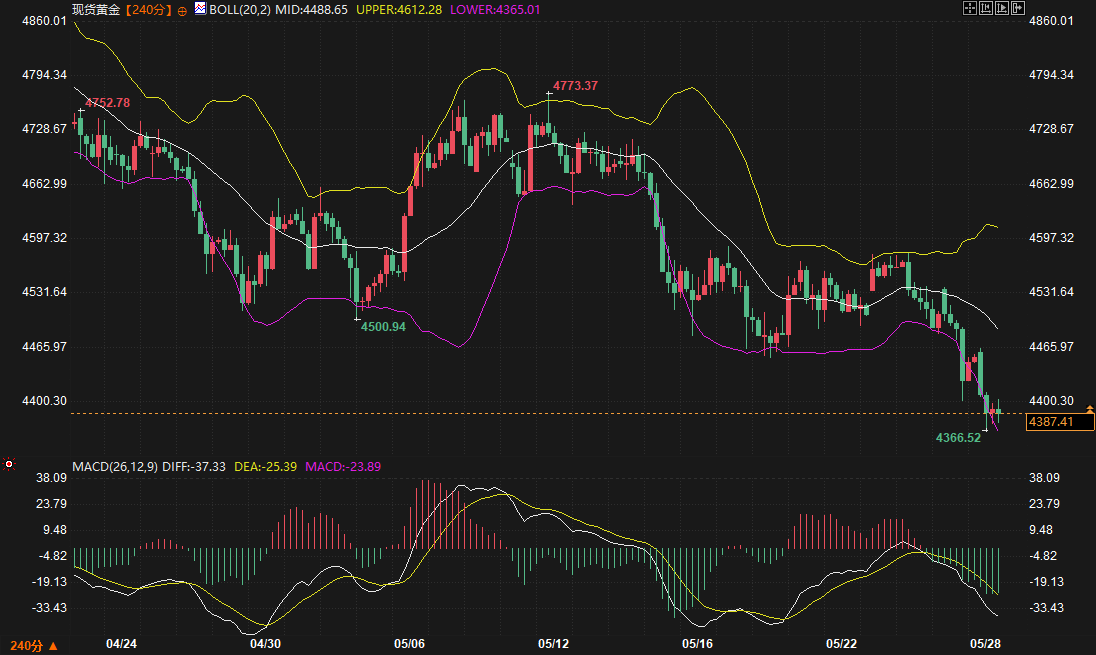
Spot gold is currently trading at $4387.41 per ounce, a new low since March 26. The lower Bollinger Band on the 240-minute chart is at $4365.01, while the middle band at $4488.65 provides strong resistance. The MACD indicator's green bars are still expanding, indicating that short-term downward pressure has not yet fully dissipated. From a fundamental perspective, although geopolitical conflicts and high inflation should support gold's hedging properties, rising US Treasury yields and a stronger dollar are exerting double pressure on gold as a non-yielding asset. The market is more focused on the risk of a potential interest rate hike by the Federal Reserve, causing gold's safe-haven function to temporarily fail.
From a technical perspective, gold has broken below the 4400 psychological level. The first support zone is 4350-4370, and a decisive break below this level could lead to a further decline towards 4300. The resistance zone is 4450-4480. Logically, gold's price movement over the next 2-3 days will remain heavily influenced by PCE data. If inflation exceeds expectations and pushes up interest rate expectations, gold may continue to face downward pressure. Only if the data significantly falls short of expectations will a rebound be possible.
In the short term (next 2-3 days), core PCE data will be the decisive variable for cross-asset trends: if the data meets or exceeds expectations, the 10-year US Treasury yield is expected to rise to the 4.55%-4.60% range, the US dollar index will remain above 99.00 with a slightly strong bias, and spot gold may continue to test the 4350-4370 support level; if the data is significantly lower than expected, the US Treasury yield may fall back to around 4.45%, the US dollar index may fall back below 99.00, and gold is expected to see a technical rebound to around 4450.
In the medium term, the persistence of geopolitical conflicts and persistent inflation will support the central level of US Treasury yields above 4.3%, making it easier for the US dollar index to rise than fall. Gold is unlikely to see a sustained upward trend before the Federal Reserve issues a clear signal of interest rate cuts. Investors should be wary of the impact of the increasing correlation between US Treasuries and stocks on traditional portfolios; short-term US Treasuries currently offer significantly better investment value than long-term maturities.
1. Why does gold price fall when geopolitical conflicts escalate?
The core trading logic in the market at the current stage is that rising inflation is pushing up expectations of Fed rate hikes, rising US Treasury yields are increasing the opportunity cost of holding gold, and a stronger dollar is also suppressing the price of gold denominated in dollars. Therefore, in the short term, gold's inflation hedging attribute has given way to interest rate pressure.
2. What does "gap filling" mean in the US Treasury yield curve?
Gap filling is a common phenomenon in technical analysis, referring to a price movement where, after rapid fluctuations, the price returns to the area where it previously gapped up. The current gap between 4.52% and 4.554% in the 10-year US Treasury yield was formed by the previous rapid decline. If inflation data exceeds expectations, the yield will likely fill this gap before choosing a direction.
3. What impact does a stronger US dollar index have on global markets?
A stronger US dollar index will increase the depreciation pressure on non-US currencies, increase the risk of capital outflows from emerging markets, and put pressure on commodity prices denominated in US dollars, which will also increase the cost for non-US countries to repay their dollar-denominated debts.
4. Why is it said that short-term bonds have more investment value than long-term bonds?
Currently, long-term bonds face multiple risks, including inflation stickiness, fiscal issuance pressure, and rising term premiums, while short-term bond yields are already at a relatively high level and are less affected by long-term inflation uncertainty, making them more cost-effective during periods of high interest rate volatility.
5. In what ways does core PCE data affect policy?
The core PCE is the inflation indicator that the Federal Reserve pays the most attention to. If the data continues to be higher than the 2% policy target, the Federal Reserve will postpone the timing of interest rate cuts and may even restart interest rate hikes, which will directly affect global liquidity expectations and the pricing logic of various assets.
US Treasury yields: Range-bound trading amid bullish and bearish battles
Data shows that the 10-year US Treasury yield is currently at 4.503%, with the 240-minute Bollinger Bands showing the middle band at 4.504%, the upper band at 4.562%, and the lower band at 4.445%. The MACD indicator shows a slight expansion of the red bars, indicating a short-term balance between bullish and bearish forces. From a fundamental perspective, the rise in oil prices triggered by the Russia-Ukraine conflict has pushed up inflation expectations. Major overseas institutions predict that if the upcoming core PCE year-on-year growth rate rises to 3.3%, it will further reinforce the Federal Reserve's "higher and longer" interest rate stance, and the 10-year yield is expected to fill the previous gap of 4.52%-4.554%. If the data exceeds expectations and reaches a month-on-month growth rate of 0.4%, the yield may rise above 4.60%.
From a technical perspective, the 10-year Treasury yield, after breaking through the Bollinger Band's narrowing range from 4.22% to 4.682%, has now retraced to confirm the middle band, with the 4.43%-4.47% range providing strong support. The 2-year Treasury yield is currently at 4.061%, with the Bollinger Band middle band at 4.062% almost coinciding with the current price, indicating a short-term trading range of 4.00%-4.13%. Logically, the current tactical trading strategy in the US Treasury market is primarily range-bound, with 4.48%-4.53% being the core trading range for the 10-year yield over the next 2-3 days. An upward breakout requires a clear catalyst from inflation data.
US Dollar Index: Geopolitical Premiums Support Upward Trend
The US dollar index is currently at 99.3515. On the 240-minute chart, the upper Bollinger Band is at 99.4209, and the lower band is at 98.8574. The MACD indicator shows a continued expansion of the red bars, indicating that short-term upward momentum remains. From a fundamental perspective, safe-haven inflows amid escalating geopolitical conflicts, coupled with rising inflation expectations delaying the timing of the Federal Reserve's interest rate cuts, have jointly supported the strengthening of the US dollar index. It has now broken through the upper limit of its previous trading range, reaching a one-week high of 99.5477.
From a technical perspective, the US dollar index has stabilized above the key resistance level of 99.20, with support levels in the 98.90-99.00 range. If inflation data exceeds expectations, it could potentially rise further to the 99.60-99.70 range. Logically, the current strength of the US dollar is supported by both safe-haven appeal and policy expectations. If core PCE data does not significantly fall short of expectations in the next 2-3 days, the US dollar index is likely to maintain a slightly bullish trend with limited downside.
Spot gold: Inflation hedging function temporarily gives way to interest rate pressure.
Spot gold is currently trading at $4387.41 per ounce, a new low since March 26. The lower Bollinger Band on the 240-minute chart is at $4365.01, while the middle band at $4488.65 provides strong resistance. The MACD indicator's green bars are still expanding, indicating that short-term downward pressure has not yet fully dissipated. From a fundamental perspective, although geopolitical conflicts and high inflation should support gold's hedging properties, rising US Treasury yields and a stronger dollar are exerting double pressure on gold as a non-yielding asset. The market is more focused on the risk of a potential interest rate hike by the Federal Reserve, causing gold's safe-haven function to temporarily fail.
From a technical perspective, gold has broken below the 4400 psychological level. The first support zone is 4350-4370, and a decisive break below this level could lead to a further decline towards 4300. The resistance zone is 4450-4480. Logically, gold's price movement over the next 2-3 days will remain heavily influenced by PCE data. If inflation exceeds expectations and pushes up interest rate expectations, gold may continue to face downward pressure. Only if the data significantly falls short of expectations will a rebound be possible.
Trend Outlook
In the short term (next 2-3 days), core PCE data will be the decisive variable for cross-asset trends: if the data meets or exceeds expectations, the 10-year US Treasury yield is expected to rise to the 4.55%-4.60% range, the US dollar index will remain above 99.00 with a slightly strong bias, and spot gold may continue to test the 4350-4370 support level; if the data is significantly lower than expected, the US Treasury yield may fall back to around 4.45%, the US dollar index may fall back below 99.00, and gold is expected to see a technical rebound to around 4450.
In the medium term, the persistence of geopolitical conflicts and persistent inflation will support the central level of US Treasury yields above 4.3%, making it easier for the US dollar index to rise than fall. Gold is unlikely to see a sustained upward trend before the Federal Reserve issues a clear signal of interest rate cuts. Investors should be wary of the impact of the increasing correlation between US Treasuries and stocks on traditional portfolios; short-term US Treasuries currently offer significantly better investment value than long-term maturities.
Frequently Asked Questions
1. Why does gold price fall when geopolitical conflicts escalate?
The core trading logic in the market at the current stage is that rising inflation is pushing up expectations of Fed rate hikes, rising US Treasury yields are increasing the opportunity cost of holding gold, and a stronger dollar is also suppressing the price of gold denominated in dollars. Therefore, in the short term, gold's inflation hedging attribute has given way to interest rate pressure.
2. What does "gap filling" mean in the US Treasury yield curve?
Gap filling is a common phenomenon in technical analysis, referring to a price movement where, after rapid fluctuations, the price returns to the area where it previously gapped up. The current gap between 4.52% and 4.554% in the 10-year US Treasury yield was formed by the previous rapid decline. If inflation data exceeds expectations, the yield will likely fill this gap before choosing a direction.
3. What impact does a stronger US dollar index have on global markets?
A stronger US dollar index will increase the depreciation pressure on non-US currencies, increase the risk of capital outflows from emerging markets, and put pressure on commodity prices denominated in US dollars, which will also increase the cost for non-US countries to repay their dollar-denominated debts.
4. Why is it said that short-term bonds have more investment value than long-term bonds?
Currently, long-term bonds face multiple risks, including inflation stickiness, fiscal issuance pressure, and rising term premiums, while short-term bond yields are already at a relatively high level and are less affected by long-term inflation uncertainty, making them more cost-effective during periods of high interest rate volatility.
5. In what ways does core PCE data affect policy?
The core PCE is the inflation indicator that the Federal Reserve pays the most attention to. If the data continues to be higher than the 2% policy target, the Federal Reserve will postpone the timing of interest rate cuts and may even restart interest rate hikes, which will directly affect global liquidity expectations and the pricing logic of various assets.
- Risk Warning and Disclaimer
- The market involves risk, and trading may not be suitable for all investors. This article is for reference only and does not constitute personal investment advice, nor does it take into account certain users’ specific investment objectives, financial situation, or other needs. Any investment decisions made based on this information are at your own risk.