Gold Technical Analysis: A Key Decision at the End of the Channel – PCE Data Will Determine Short-Term Direction
2026-05-28 20:15:08
From a daily chart perspective, spot gold entered a clear downward channel after reaching a high of 5596.33 in early 2026. The brown trend line in the chart outlines the upper and lower rails of the channel. The gold price is slowly declining along the lower side of the middle rail of the channel. The downtrend has not been completely reversed, but the downward momentum has clearly weakened.

Gold prices are currently testing the 200-day moving average (around 4393.58), a significant long-term support level. This level also coincides with the upward trendline from the previous low of 4099.02 and is a key intersection area of the lower channel line. Historically, when gold prices touch long-term moving averages during a decline, there is often resistance from the bulls. Considering that prices have reached the end of the previous downward wave, the probability of another significant break below this level is decreasing.
Moving average and channel structure analysis
The short-term moving averages (MA20/MA50) are arranged in a bearish pattern, and the gold price is trading below them, indicating a still weak short-term trend. However, the gap between the MA100 (4800.50) and MA200 (4393.58) is narrowing, and the downward slope is slowing down.
In the downward channel that began in mid-April, gold prices have fallen from above $4,700 to around $4,380 currently, a drop of nearly $300, and the price has shown signs of being oversold in the short term.
Key support levels below: The support zone of 4360-4390 is formed by connecting the 200-day moving average (MA200) and the previous low. If this area is broken, gold prices will open up downside potential, with the next target being the important previous support level around 4250.
Key resistance levels above: First, the MA20 moving average around 4500; second, the MA50 moving average around 4628; and third, the 61.8% Fibonacci retracement level between 4690 and 4700.
Fibonacci and rebound target calculation
Regarding the downward trend since mid-April, we calculated the Fibonacci retracement from the high of 4777.78 to the low of 4366.52:
23.6% Fibonacci retracement level: 4491.37 (short-term weak resistance)
38.2% retracement level: 4567.36
50% retracement level: 4628.82 (coinciding with the 50-day moving average, strong resistance)
61.8% retracement level: 4690.28-4700 (the middle line of the channel coincides with the previous platform, the core rebound target)
Historically, gold prices typically rebound to the 50%-61.8% range of the previous decline, corresponding to the 4628-4700 area. This is the core observation range for this round of rebound.
Technical indicator signals
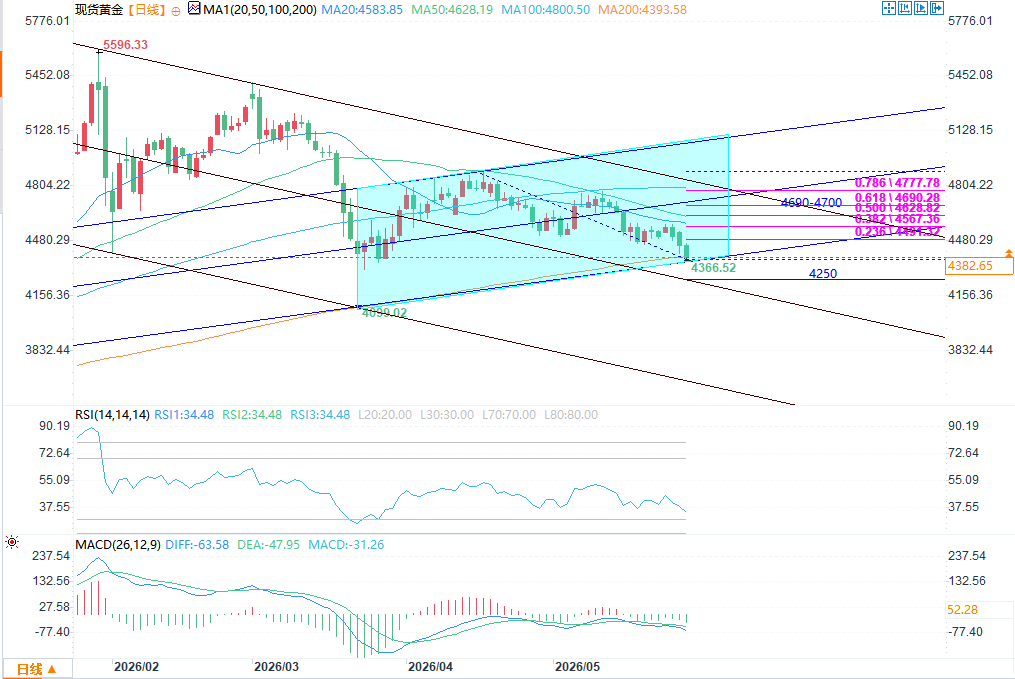
(Spot gold daily chart source: FX678)
RSI(14): The current value is 34.48, which is close to the oversold range (below 30), indicating that the short-term downward momentum has been overexerted and there is a need for a technical rebound.
MACD (26,12,9): The DIFF and DEA lines are still below the zero axis, but the green bars have shown signs of shrinking volume, indicating that the downward momentum is weakening. There is a potential for a golden cross at a low level. If the golden cross forms, it will confirm a short-term rebound signal.
Fundamentals: Under multiple negative pressures, PCE data will become a key short-term variable.
The current fundamental environment for gold is generally bearish, with multiple factors collectively suppressing gold price movements:
The Fed's rate hike expectations have been delayed: Market expectations for a Fed rate cut have continued to be postponed, and the high-interest-rate environment continues to put downward pressure on the holding cost of gold, a non-interest-bearing asset.
Rising US Treasury yields and a stronger dollar: The increase in US Treasury yields has boosted the attractiveness of dollar-denominated assets, while the strengthening of the dollar index has further weakened demand for dollar-denominated gold.
Geopolitical risks are weakening: the safe-haven sentiment that previously supported gold prices has subsided, safe-haven buying of gold continues to flow out, and fundamental support is weakening.
However, the market has already priced in high expectations for the April PCE inflation data, making it more likely that tonight's PCE data will fall short of expectations. If the data does indeed fall short of expectations, it will alleviate market concerns about the Federal Reserve maintaining high interest rates, potentially causing the dollar and US Treasury yields to decline, thus providing upward momentum for gold. Conversely, if the data exceeds expectations, it will further strengthen expectations that the Fed will maintain high interest rates for longer, and gold prices will likely break below the 200-day moving average support, initiating a new round of decline and potentially testing the 4250 level.
Scenario simulation and trading reference
Scenario 1: PCE data is lower than expected (high probability)
Triggering conditions: PCE inflation data is lower than market expectations, and market expectations for interest rate cuts rise slightly.
Price Path: After holding the MA200 support, gold prices rebounded, first testing the resistance near 4500. After breaking through, it will move towards the 4628 (MA50 + 50% Fibonacci) and 4690-4700 (61.8% Fibonacci) areas, which are also the core rebound target range of this round of decline.
Scenario 2: PCE data exceeds expectations
Triggering conditions: PCE inflation data exceeds expectations, and market expectations for the Federal Reserve to raise interest rates/maintain high interest rates are strengthened.
Price Path: Gold prices broke below the MA200 support, and the lower rail of the downward channel was breached, indicating a continuation of the downtrend. Gold prices are expected to fall back towards the previous important support level around 4250, closing the window for a potential rebound.
Summarize
Gold is currently at a critical juncture, characterized by "oversold technicals and unverified fundamentals." The price has touched the support of the long-term moving average at the end of the downward channel, and with indicators showing oversold conditions, the probability of a short-term technical rebound is increasing. However, the height and sustainability of the rebound will depend entirely on tonight's PCE inflation data.
For subsequent trading, the key focus in the short term should be on the defense of the 4360-4390 support zone. If the support holds and the data is positive, a rebound to the 4628-4700 range is possible. If the support is broken, the risk of a pullback to the 4250 level should be noted. Going forward, it is necessary to continuously monitor speeches by Federal Reserve officials, the trend of US Treasury yields, and marginal changes in the geopolitical situation to confirm reversal signals in the gold trend.
Gold prices are currently testing the 200-day moving average (around 4393.58), a significant long-term support level. This level also coincides with the upward trendline from the previous low of 4099.02 and is a key intersection area of the lower channel line. Historically, when gold prices touch long-term moving averages during a decline, there is often resistance from the bulls. Considering that prices have reached the end of the previous downward wave, the probability of another significant break below this level is decreasing.
Moving average and channel structure analysis
The short-term moving averages (MA20/MA50) are arranged in a bearish pattern, and the gold price is trading below them, indicating a still weak short-term trend. However, the gap between the MA100 (4800.50) and MA200 (4393.58) is narrowing, and the downward slope is slowing down.
In the downward channel that began in mid-April, gold prices have fallen from above $4,700 to around $4,380 currently, a drop of nearly $300, and the price has shown signs of being oversold in the short term.
Key support levels below: The support zone of 4360-4390 is formed by connecting the 200-day moving average (MA200) and the previous low. If this area is broken, gold prices will open up downside potential, with the next target being the important previous support level around 4250.
Key resistance levels above: First, the MA20 moving average around 4500; second, the MA50 moving average around 4628; and third, the 61.8% Fibonacci retracement level between 4690 and 4700.
Fibonacci and rebound target calculation
Regarding the downward trend since mid-April, we calculated the Fibonacci retracement from the high of 4777.78 to the low of 4366.52:
23.6% Fibonacci retracement level: 4491.37 (short-term weak resistance)
38.2% retracement level: 4567.36
50% retracement level: 4628.82 (coinciding with the 50-day moving average, strong resistance)
61.8% retracement level: 4690.28-4700 (the middle line of the channel coincides with the previous platform, the core rebound target)
Historically, gold prices typically rebound to the 50%-61.8% range of the previous decline, corresponding to the 4628-4700 area. This is the core observation range for this round of rebound.
Technical indicator signals
(Spot gold daily chart source: FX678)
RSI(14): The current value is 34.48, which is close to the oversold range (below 30), indicating that the short-term downward momentum has been overexerted and there is a need for a technical rebound.
MACD (26,12,9): The DIFF and DEA lines are still below the zero axis, but the green bars have shown signs of shrinking volume, indicating that the downward momentum is weakening. There is a potential for a golden cross at a low level. If the golden cross forms, it will confirm a short-term rebound signal.
Fundamentals: Under multiple negative pressures, PCE data will become a key short-term variable.
The current fundamental environment for gold is generally bearish, with multiple factors collectively suppressing gold price movements:
The Fed's rate hike expectations have been delayed: Market expectations for a Fed rate cut have continued to be postponed, and the high-interest-rate environment continues to put downward pressure on the holding cost of gold, a non-interest-bearing asset.
Rising US Treasury yields and a stronger dollar: The increase in US Treasury yields has boosted the attractiveness of dollar-denominated assets, while the strengthening of the dollar index has further weakened demand for dollar-denominated gold.
Geopolitical risks are weakening: the safe-haven sentiment that previously supported gold prices has subsided, safe-haven buying of gold continues to flow out, and fundamental support is weakening.
However, the market has already priced in high expectations for the April PCE inflation data, making it more likely that tonight's PCE data will fall short of expectations. If the data does indeed fall short of expectations, it will alleviate market concerns about the Federal Reserve maintaining high interest rates, potentially causing the dollar and US Treasury yields to decline, thus providing upward momentum for gold. Conversely, if the data exceeds expectations, it will further strengthen expectations that the Fed will maintain high interest rates for longer, and gold prices will likely break below the 200-day moving average support, initiating a new round of decline and potentially testing the 4250 level.
Scenario simulation and trading reference
Scenario 1: PCE data is lower than expected (high probability)
Triggering conditions: PCE inflation data is lower than market expectations, and market expectations for interest rate cuts rise slightly.
Price Path: After holding the MA200 support, gold prices rebounded, first testing the resistance near 4500. After breaking through, it will move towards the 4628 (MA50 + 50% Fibonacci) and 4690-4700 (61.8% Fibonacci) areas, which are also the core rebound target range of this round of decline.
Scenario 2: PCE data exceeds expectations
Triggering conditions: PCE inflation data exceeds expectations, and market expectations for the Federal Reserve to raise interest rates/maintain high interest rates are strengthened.
Price Path: Gold prices broke below the MA200 support, and the lower rail of the downward channel was breached, indicating a continuation of the downtrend. Gold prices are expected to fall back towards the previous important support level around 4250, closing the window for a potential rebound.
Summarize
Gold is currently at a critical juncture, characterized by "oversold technicals and unverified fundamentals." The price has touched the support of the long-term moving average at the end of the downward channel, and with indicators showing oversold conditions, the probability of a short-term technical rebound is increasing. However, the height and sustainability of the rebound will depend entirely on tonight's PCE inflation data.
For subsequent trading, the key focus in the short term should be on the defense of the 4360-4390 support zone. If the support holds and the data is positive, a rebound to the 4628-4700 range is possible. If the support is broken, the risk of a pullback to the 4250 level should be noted. Going forward, it is necessary to continuously monitor speeches by Federal Reserve officials, the trend of US Treasury yields, and marginal changes in the geopolitical situation to confirm reversal signals in the gold trend.
- Risk Warning and Disclaimer
- The market involves risk, and trading may not be suitable for all investors. This article is for reference only and does not constitute personal investment advice, nor does it take into account certain users’ specific investment objectives, financial situation, or other needs. Any investment decisions made based on this information are at your own risk.